Audit
Investigate the network state, search through configurations, and monitor device behavior without impacting the live environment, with the Audit module.
Compliance
The Compliance module checks that the operational state of your devices meets your requirements. You describe a requirement as a rule, Avalon runs it on the selected devices and produces a compliance report, which can be scheduled and tracked over time.
A rule is built visually by connecting blocks. It never changes the configuration: compliance is read-only.
What a rule can reason about
Most rules query a data gathering template. Before writing one, have a look at the Data gathering templates page: it lists the available templates and, for each, the exact fields you will be able to set a condition on.
Overview
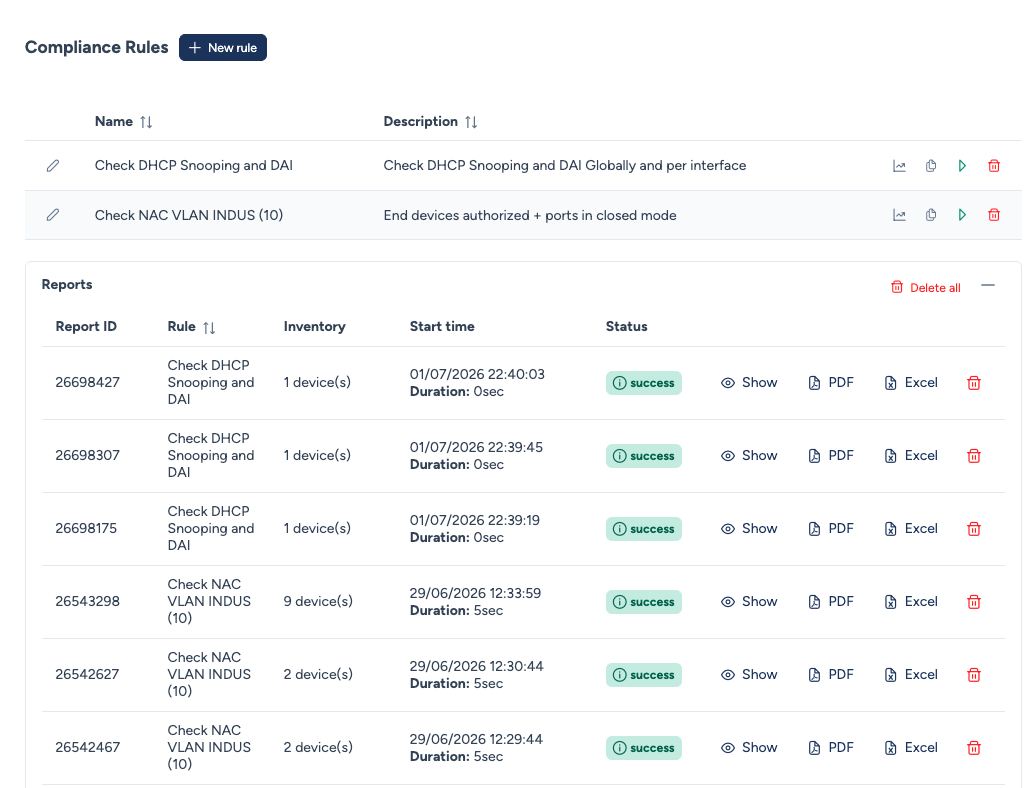
The Compliance Rules page lists your rules; create one with New rule. Each rule offers these actions:
- Edit (pencil): open the rule in the builder.
- Trend: show the rule's compliance trend over time.
- Duplicate: duplicate the rule to adapt it.
- Run: launch the audit on a selection of devices.
- Delete: remove the rule.
Below, the Reports panel keeps the run history. Each report offers Show (detailed view), PDF and Excel export, and deletion; Delete all clears the whole history.
The rule builder
A rule is a directed graph: data flows along the links, from the sources (left) to the assertions (right). As soon as a block is connected to an upstream block, it automatically receives its output and transforms it according to its role. You run nothing manually: Avalon walks the graph in order at audit time.
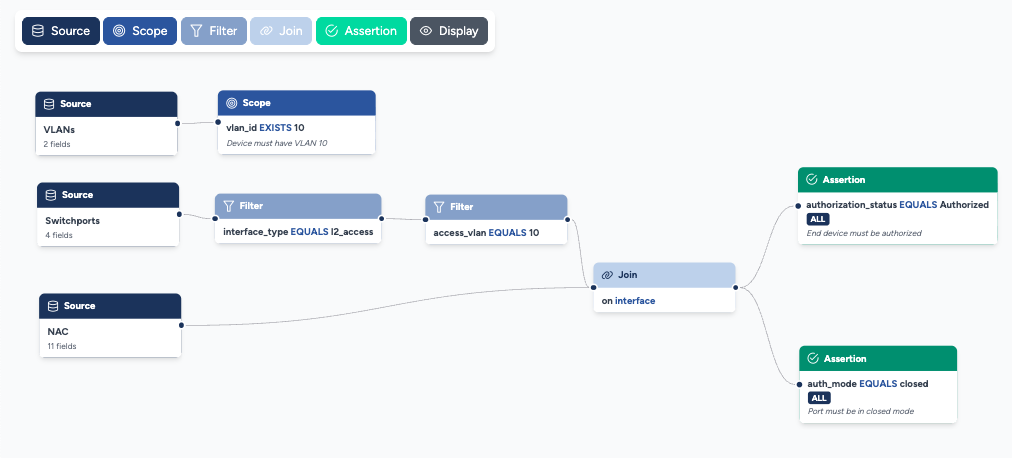
Each block has a specific role:
| Block | Role |
|---|---|
| Source | Where the data comes from: a gathering template (read from the device, connection required) or a source from the Avalon database (Device, Device Ports), with no connection. |
| Scope | Restricts the devices audited according to their inventory attributes (model, version, device type...). Scopes are evaluated first: an out-of-scope device is skipped without a connection (when the inventory is enough to determine it) and does not count toward the compliance rates. |
| Filter | Restricts the rows of a source based on a field value (e.g., keep only trunk ports). |
| Join | Merges two sources on a common field (e.g., interface) to cross their columns. |
| Assertion | The requirement to check: a field, an operator, a value and a Quantifier. |
| Display | Chooses the columns shown in the report. |
Connecting blocks
Each block type accepts a defined number of inputs, and some are mandatory for a rule to be valid:
| Block | Inputs | Output | Mandatory |
|---|---|---|---|
| Source | None (starting point) | Yes | Yes, at least one |
| Scope | One | No | No (none, one or several) |
| Filter | One | Yes | No |
| Join | Two or more | Yes | No (only to cross sources) |
| Assertion | One | No | Yes, at least one |
| Display | One | No | No |
- A single Source can feed several downstream blocks: the same dataset then serves several branches (e.g., a trust source checked by two different assertions).
- Scope, Filter, Assertion and Display accept only one input: a second link to the same block is rejected.
- You can (and should, if needed) place several Scope blocks. A device must satisfy all scopes to enter the perimeter (logical AND): handy to combine criteria, for example a specific model and a given device type.
- A Scope has no output: a Source (optionally filtered) feeds it and its branch ends there. It only selects the audited devices; it is therefore never linked to a Join or an Assertion, which have their own sources.
- A Join is only useful when you cross at least two sources on a common field.
Assertion and Quantifier
The assertion applies to the rows reaching it. The Quantifier defines the success rule:
- ALL: every row must satisfy the condition.
- EXISTS: at least one row must satisfy it.
- NONE: no row must satisfy it.
Data sources
Three families of sources are available:
- Gathering templates: data read from the device via a gathering template (Switchports, VLANs, NAC, DHCP Snooping, DAI, MAC Address Table, Hardware...). Collection requires a connection to the device. The full list and field details are on the Data gathering templates page.
- Device: one row per device from the inventory (hostname, model, version, device type...). No connection required, so this source can serve as a scope.
- Device Ports: one row per port from the inventory. Notably exposes the
is_managed_uplinkfield: true for trunk ports (l2_8021q) connected to a managed switch that is upstream (toward the core) or on a horizontal link. Aggregates are reported under the name of their aggregation interface.
Field origin
In the selectors, each field shows its source in parentheses (e.g., Trust State (DAI Trust)) so you know where the checked attribute comes from.
Operators
| Operator | Meaning | Example |
|---|---|---|
EQUALS / NOT_EQUALS |
Equal / different, case and whitespace insensitive. | trusted EQUALS yes: the DHCP snooping trusted port is correctly set. |
CONTAINS / NOT_CONTAINS |
The found value contains / does not contain the given substring. A text operator, not a set one. | version CONTAINS 17.09 |
CONTAINS_ALL |
Every expected value is present in the found list. | snooping_vlans CONTAINS_ALL [tenant VLANs]: snooping covers all declared VLANs. |
CONTAINS_ANY |
The found list and the expected list share at least one value. | access_vlan CONTAINS_ANY loopback_detection_vlans: the port's VLAN is among those protected against loops. |
IN / NOT_IN |
The found value belongs / does not belong to the provided list, compared element by element. | access_vlan IN 10, 20: the access port is on an allowed VLAN. |
MATCHES / NOT_MATCHES |
Matches / does not match a regular expression, case-insensitive. | ip_address MATCHES 192.168.25[4,5]: an IP in 192.168.254 or 192.168.255. |
EXISTS / NOT_EXISTS |
The field is set / empty. Combined with a value, tests its presence on the device. | vlan_id EXISTS 10: the device does declare VLAN 10. |
GT / GTE / LT / LTE |
Numeric comparison. On a list field, applies to the number of elements. | local_ports_names GT 1: the aggregate has more than one member. cpu_usage LT 80. |
Numeric comparison operators are only offered on number or list fields, so they can never be applied by mistake to free text.
CONTAINS is not a list operator
CONTAINS tests a substring. On a VLAN list, 10 would be found inside 100, 101 or 1000, and the rule would wrongly pass. To reason about a set, use CONTAINS_ALL or CONTAINS_ANY, which compare value by value.
VLAN ranges
Only CONTAINS_ALL and CONTAINS_ANY expand ranges: 10,20,30-32 is read as 10, 20, 30, 31, 32.
This is what makes it possible, on HP Comware, to check a configuration such as enable vlan 1 3 10 100 to 4094 without enumerating the thousands of VLANs involved. A port on VLAN 3000 is recognised as covered even though 3000 appears nowhere in the configuration.
IN compares against the literal elements of the list and would not expand the range.
Two behaviours worth knowing
CONTAINS_ALL with an empty expected list is considered non-compliant, so an incomplete rule never passes silently.
A missing field counts as zero for numeric comparisons: cpu_usage LT 80 would be true on a device whose data could not be gathered. Combine with EXISTS to tell a zero value from missing data.
Comparing to a value or to another field
An assertion compares the selected field either to a value you enter, or to another field of the same row. The Value / Field selector switches between the two modes, which are mutually exclusive.
Field mode is for when both sides of the comparison are data read from the device, rather than a reference value known in advance.
Loopback detection is such a case: the list of protected VLANs varies from port to port, so it cannot be typed into the rule. The assertion then compares two fields of the joined row, access_vlan on one side and loopback_detection_vlans on the other.
Joins and missing items
A Join crosses two sources (or more) on a common field (e.g., interface). Current behavior:
- If one branch is filtered (e.g., the uplinks from Device Ports filtered on
is_managed_uplink), it defines the tested set. The other sources graft onto it on the key: their columns are added where the key matches, left empty otherwise. A key present only in an unfiltered source is ignored. - If no branch is filtered, only the keys present in all sources are kept (intersection).
So an uplink without trust keeps its row with an empty trust column: the trusted == yes assertion fails and it comes out non-compliant.
Devices not evaluated
A collection can fail for transient reasons: a command timing out, a partial read on a busy device. Avalon retries automatically, up to three attempts two seconds apart, before giving up. Most failures clear this way and the device is actually audited.
If the collection still fails, or if the device is unreachable, it is flagged not evaluated and excluded from the rates, then counted separately in the report.
Why exclude rather than fail
An empty source is compliant by construction, since no row contradicts the assertion. If a failed collection were treated as an empty source, the device would come out compliant even though nothing could be checked, and the error would go unnoticed.
By excluding it, the report distinguishes three populations: compliant devices, non-compliant ones, and those the question could not be asked about.
Devices out of scope (skipped by the Scope) are excluded from the rates as well, and counted separately.
The report shows two complementary rates:
- the compliance rate, computed per device: the share of evaluated devices that satisfy every assertion;
- the global conformity rate, weighted by the number of rows checked: the share of compliant ports or items across all evaluated devices. A device with two failing ports out of fifty weighs differently there than in the first rate.
Scheduling, reports and trend
- Scheduling: a rule can run periodically and send a summary email (SMTP configuration must be done beforehand).
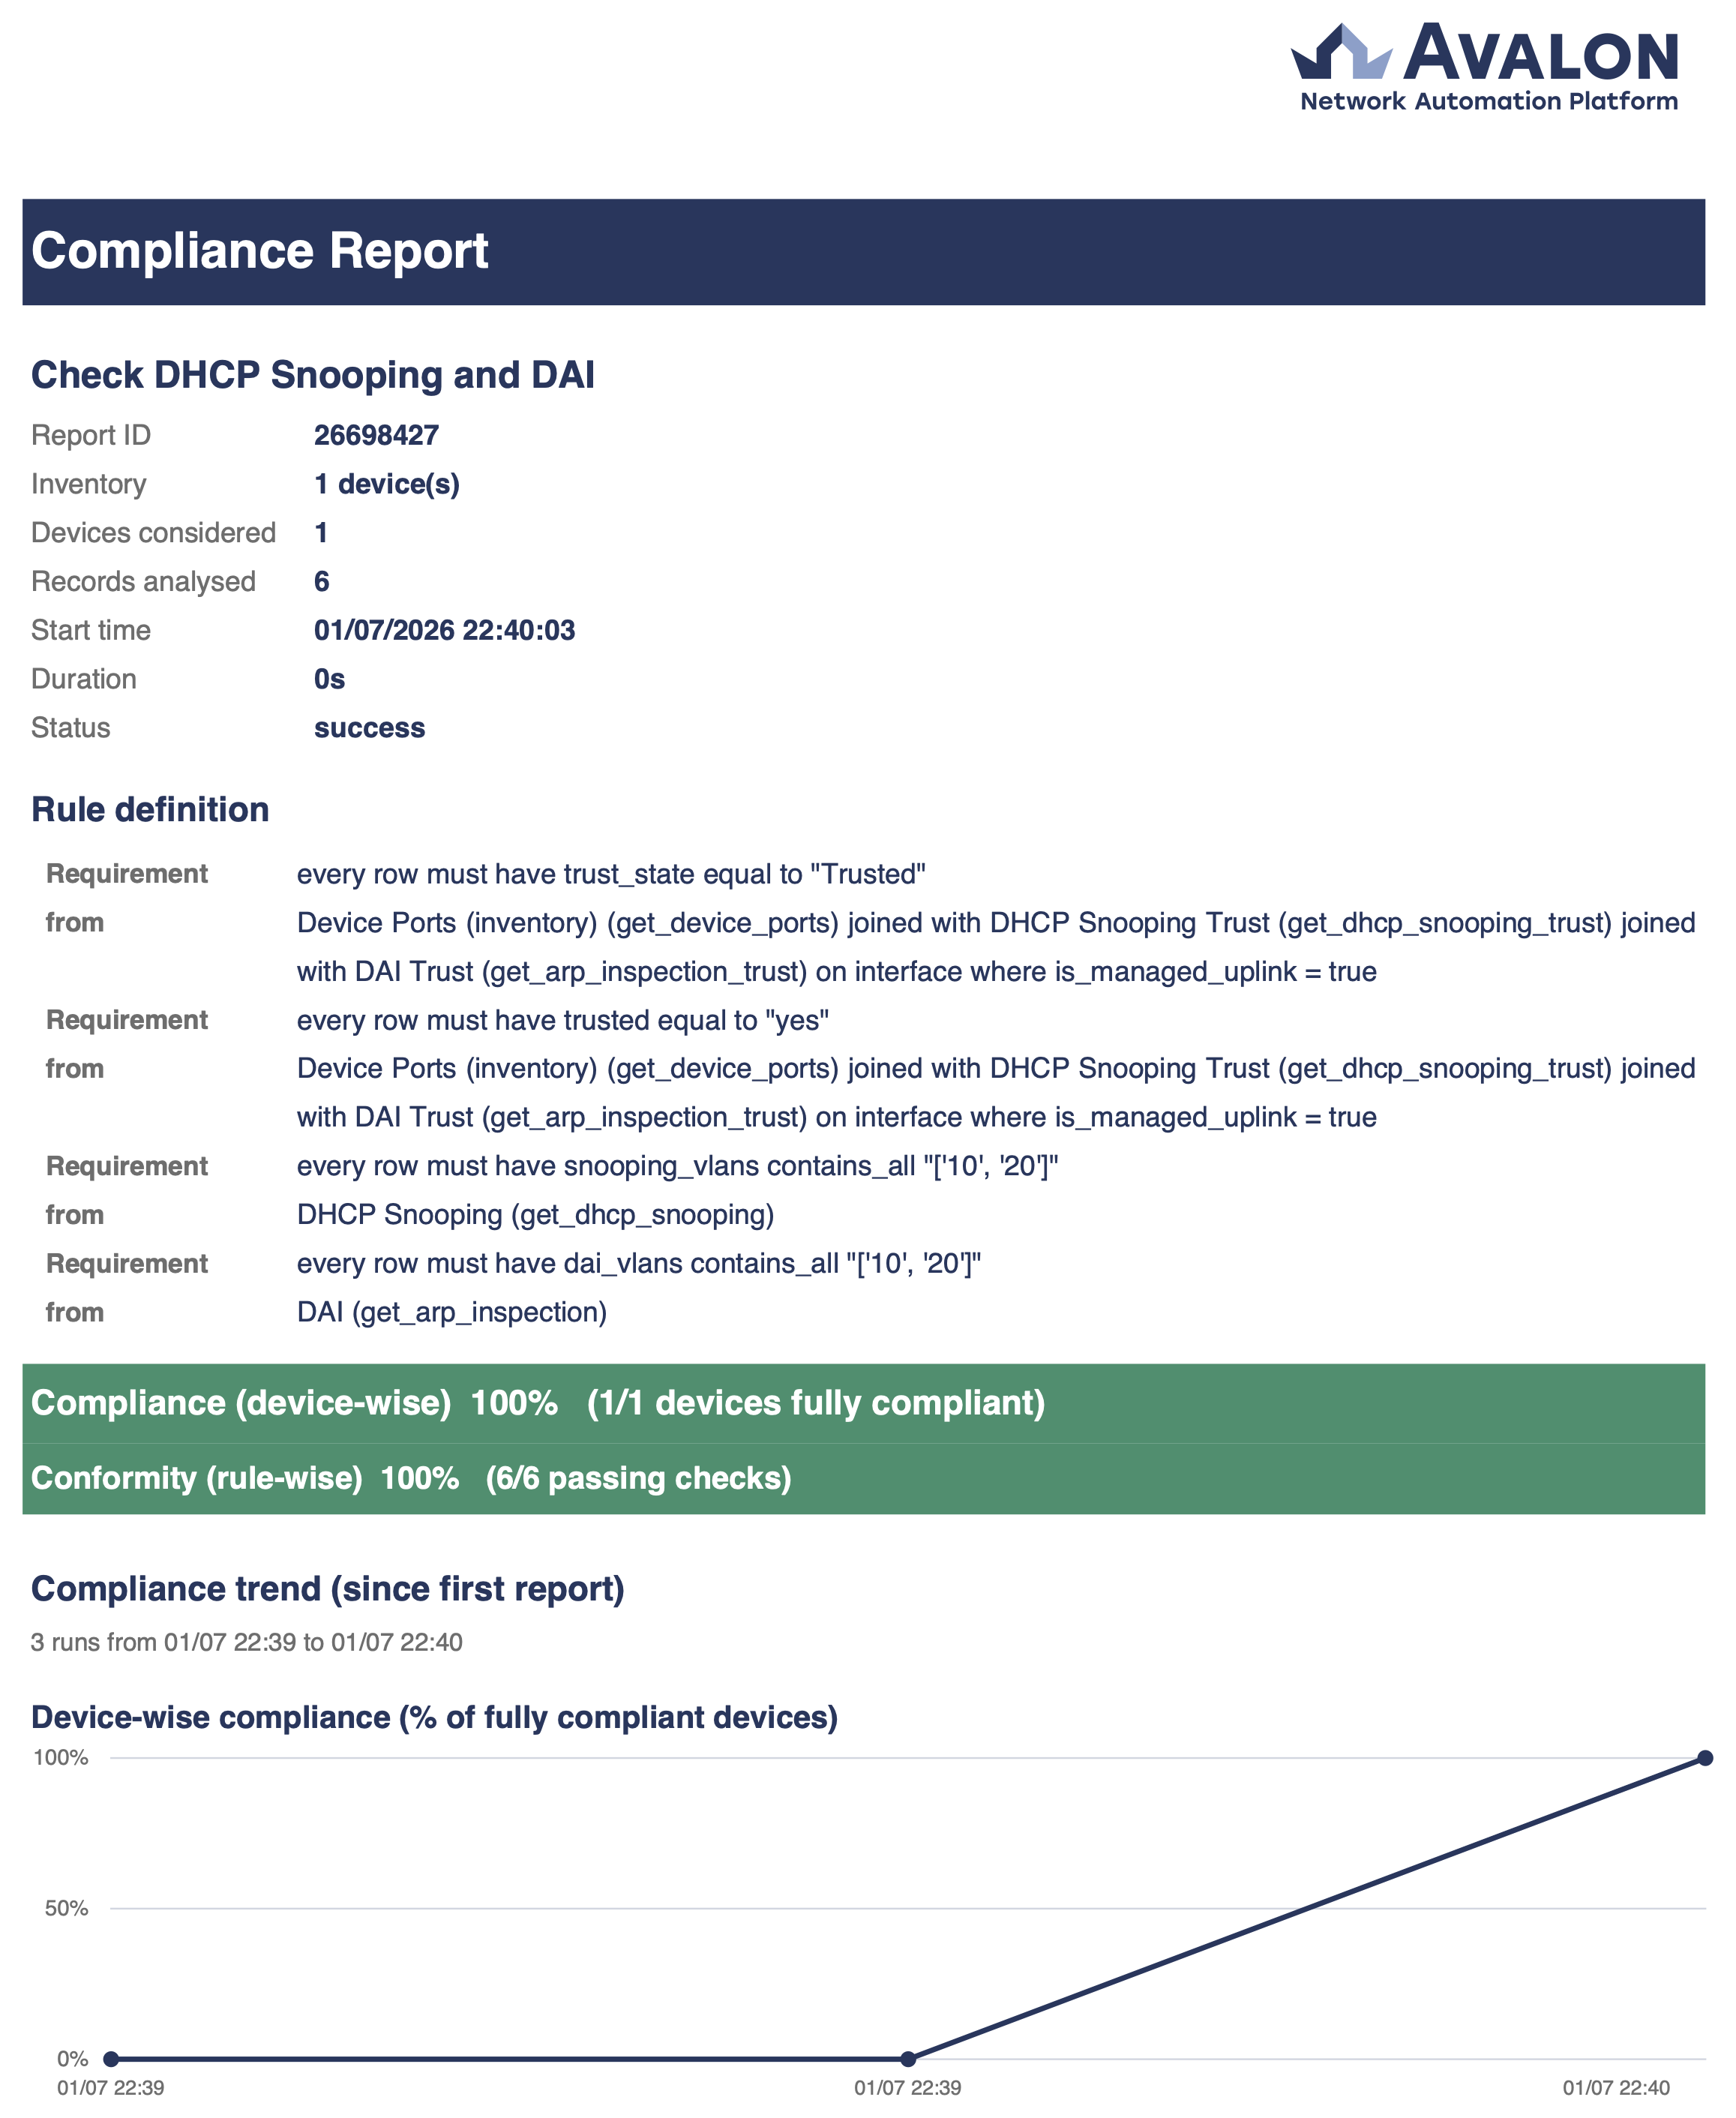
- Reports: each run produces a report you can view, exportable to PDF and Excel. The report documents the rule as audited (definition frozen at run time) and presents the results per assertion, with the compliance rate per device and global.
- Trend: compliance evolution is tracked over time since the rule's first report.
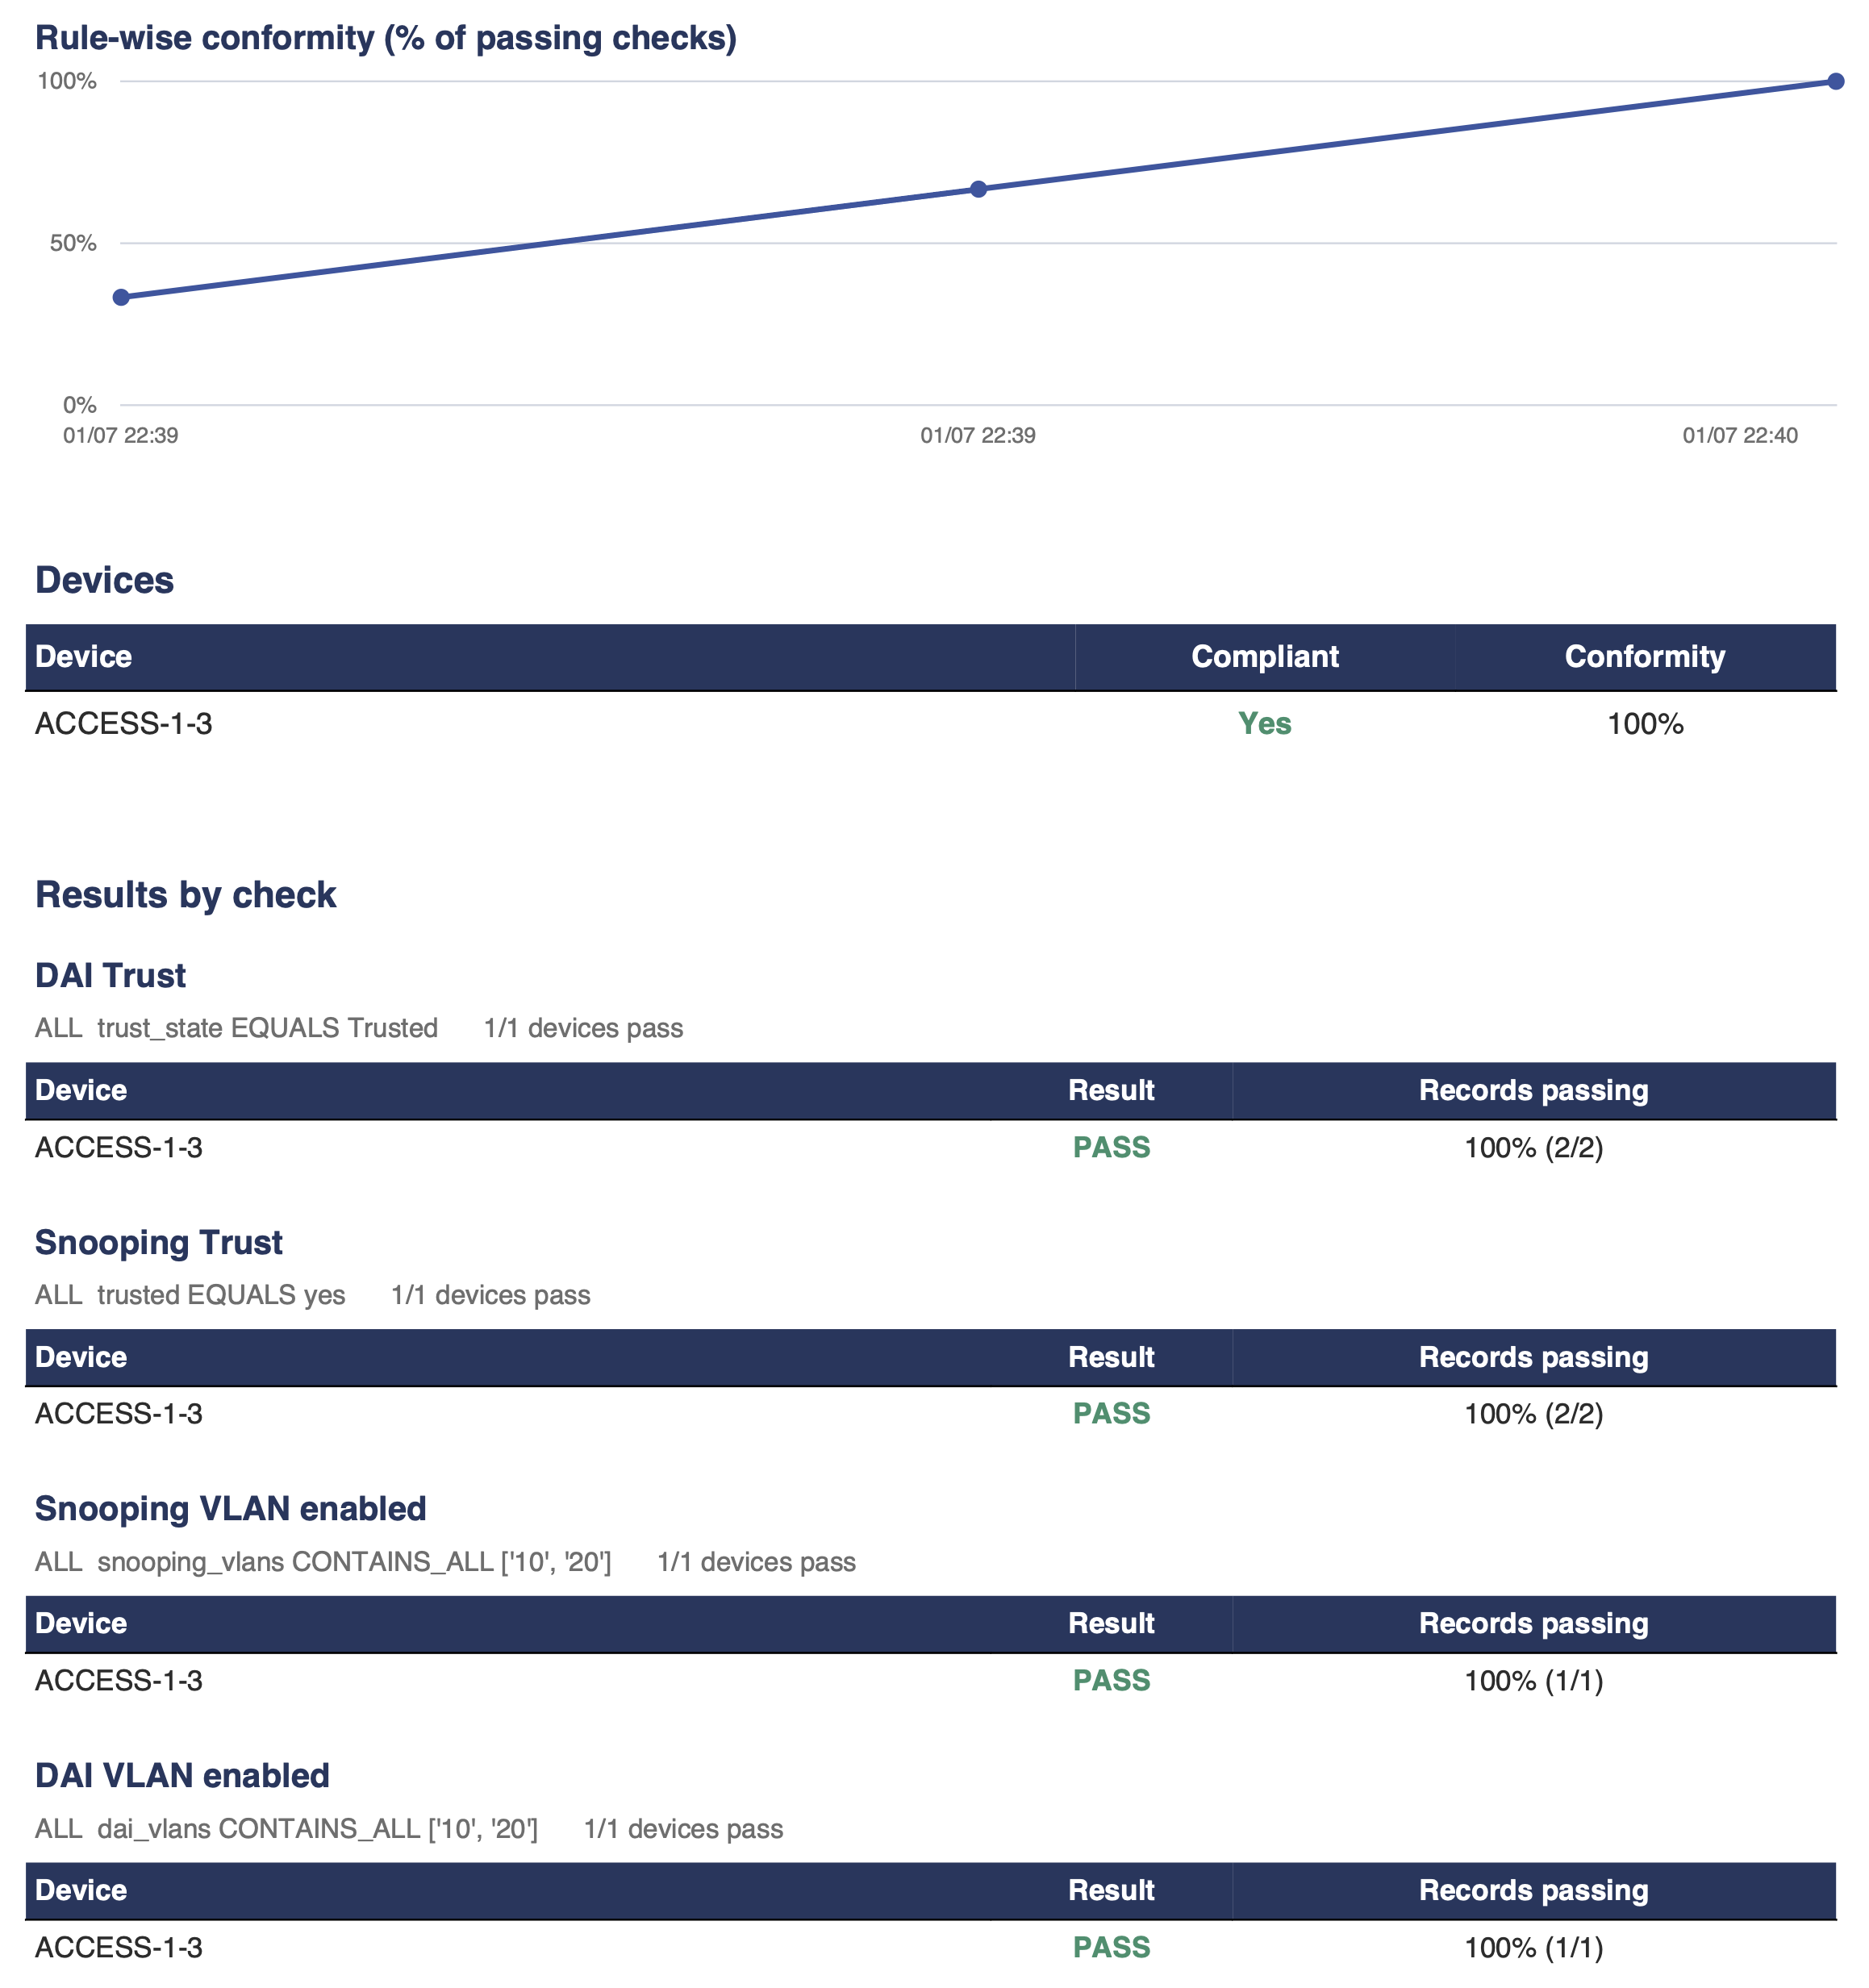
Use case: DHCP snooping and Dynamic ARP Inspection (DAI)
Goal: verify that trust is set on the right ports (the links to other switches) and that snooping and DAI cover the user VLANs. A single rule carries both features, through several assertions.
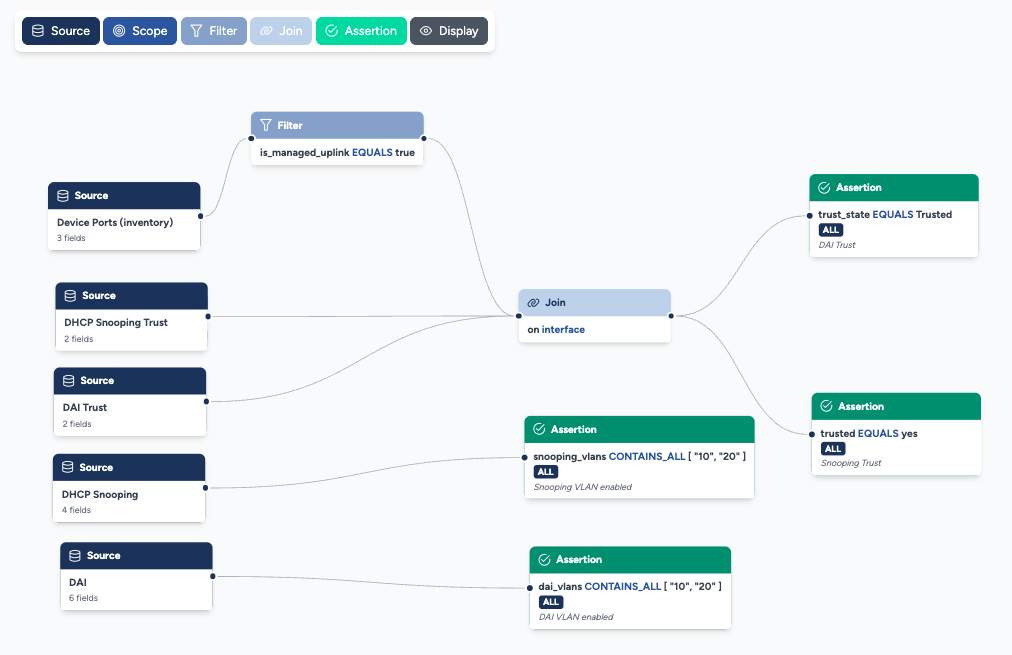
1. Trust is on the right ports
- Source Device Ports.
- Filter:
is_managed_uplinkEQUALStrue(keeps only upstream and horizontal links). - Join on
interfacewith DHCP Snooping Trust and DAI Trust. - Two assertions (Quantifier
ALL):trustedEQUALSyesandtrust_stateEQUALSTrusted.
2. Snooping and DAI cover the declared VLANs
- Source DHCP Snooping → assertion
snooping_vlansCONTAINS_ALL[tenant VLANs]. - Source DAI → assertion
dai_vlansCONTAINS_ALL[tenant VLANs].
(Quantifier ALL for both.)
A misconfigured trust port comes out as Non-compliant, a compliant device as Compliant.
Link aggregates
Trust applies to the aggregate. Avalon automatically reports the physical member ports under the name of their aggregation interface, both on the ports side and on the device output side, so the join lines up.
Data gathering
Retrieve operational state data (non-configuration data) from your devices in real-time. Generate network-wide reports: MAC address tables, CDP neighbors, VLANs, interface counters, etc.
Data collection
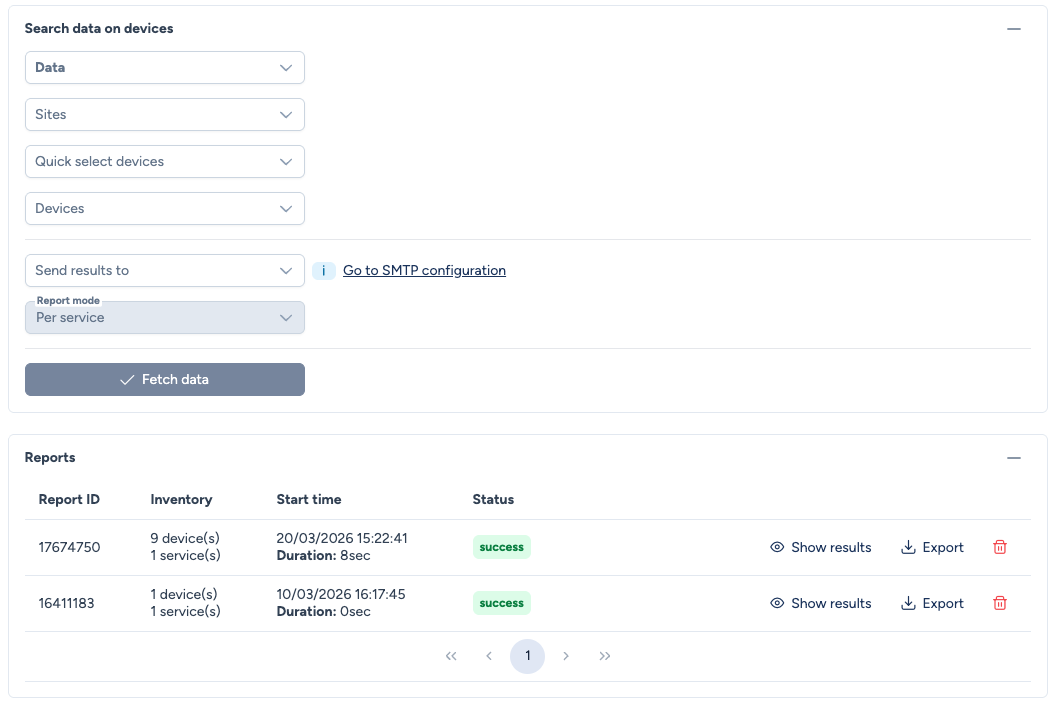
The collection form lets you configure your query:
- Data: Select one or more data types to collect (e.g.,
Switchports,MAC Address Table,NAC). - Sites: Select the sites to query.
- Quick select devices: Quick selection by device type.
- Devices: Fine-grained selection of individual devices.
- Send results to: (Optional) Select one or more recipients to receive the report by email. SMTP configuration must be done beforehand.
- Report mode: The report grouping mode (
Per serviceorPer device). - Fetch data: Launches the collection on the selected devices.
Reports
Each collection generates a report available in the Reports section. A report contains:
- Report ID: Unique report identifier.
- Inventory: Number of devices and services queried.
- Start time: Launch date and time, with execution duration.
- Status: Collection result (
success,error).
Available actions:
- Show results: Displays the detailed report results.
- Export: Downloads the data in CSV/Excel format.
- Delete: Removes the report from history.
- Delete all: Clears the tenant's whole report history. The button sits in the Reports panel icons, top right, and stays disabled while no report exists. The action cannot be undone and asks for confirmation.
Results visualization
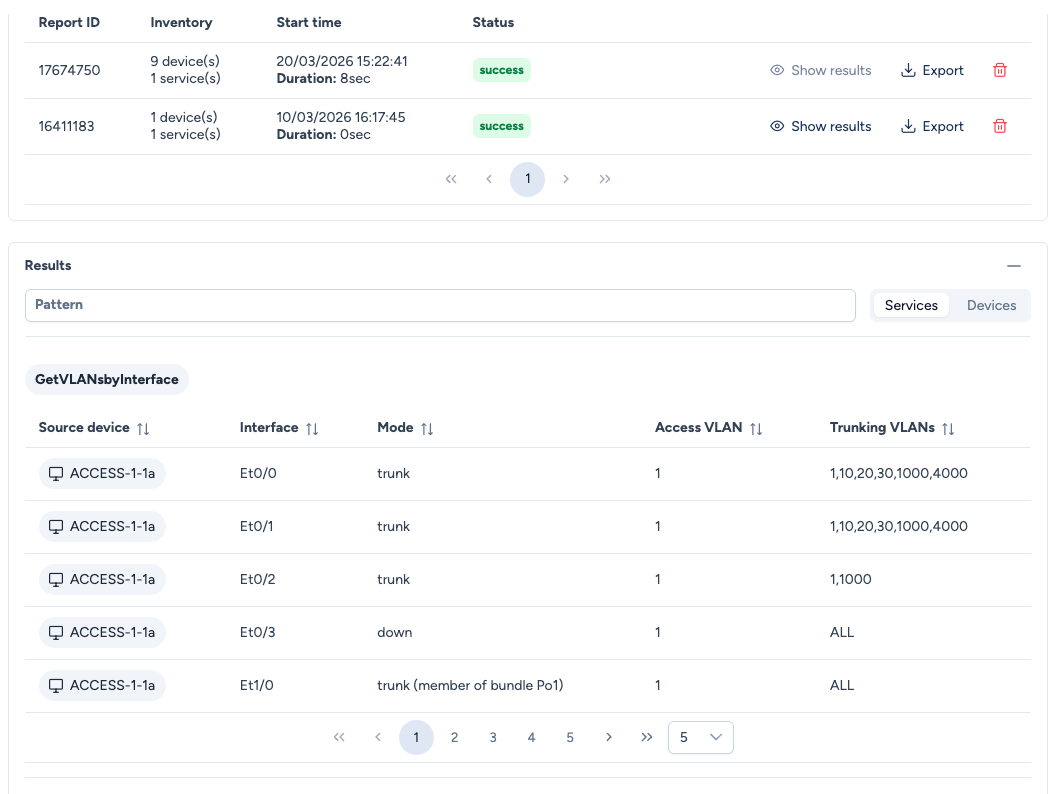
The Results section offers two perspectives to analyze the data. Toggle between them using the Services and Devices buttons:
- Services: Groups data by collection type. Ideal for global audits (e.g., "all VLAN interfaces across the entire site").
- Devices: Groups data by device. Ideal for targeted checks on a specific device.
A Pattern field lets you filter the displayed results.
Available gathering templates
Avalon ships a set of templates (VLANs, Switchports, MAC Address Table, Hardware, NAC, DHCP Snooping, DAI...), usable here for collection as well as in Compliance rules.
Each template and its columns are detailed on the Data gathering templates page.
Explore configurations
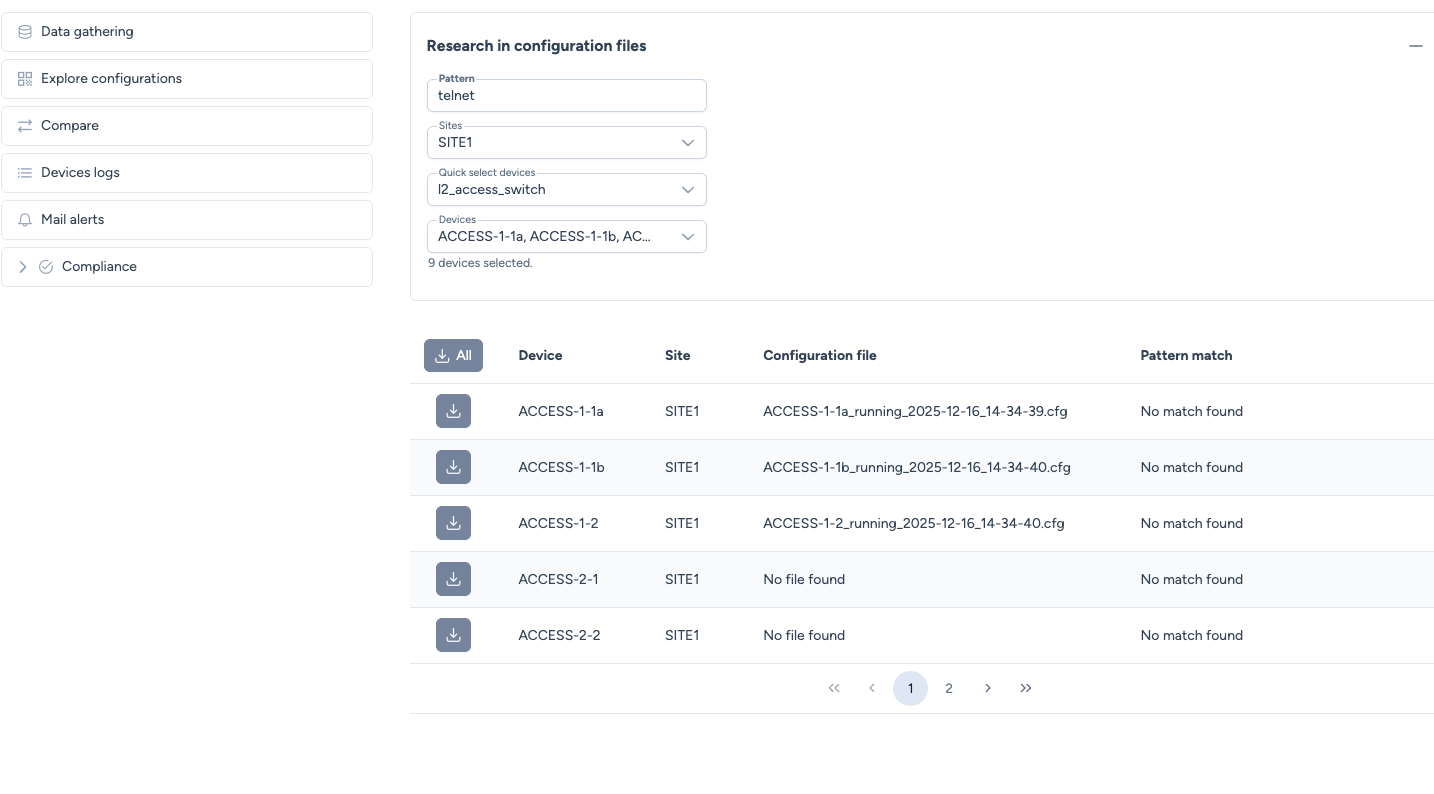
Search for specific configuration lines across hundreds of backup files without opening them individually.
Usage
- Pattern: Enter a text string or Regex (e.g.,
telnet,password 7,192.168.1.1). - Scope: Select the sites or device types to search.
Results
The table displays the match status for each device.
- Pattern match: Shows whether the string was found.
- Download: You can download the specific configuration file directly from this view.
Compare configurations
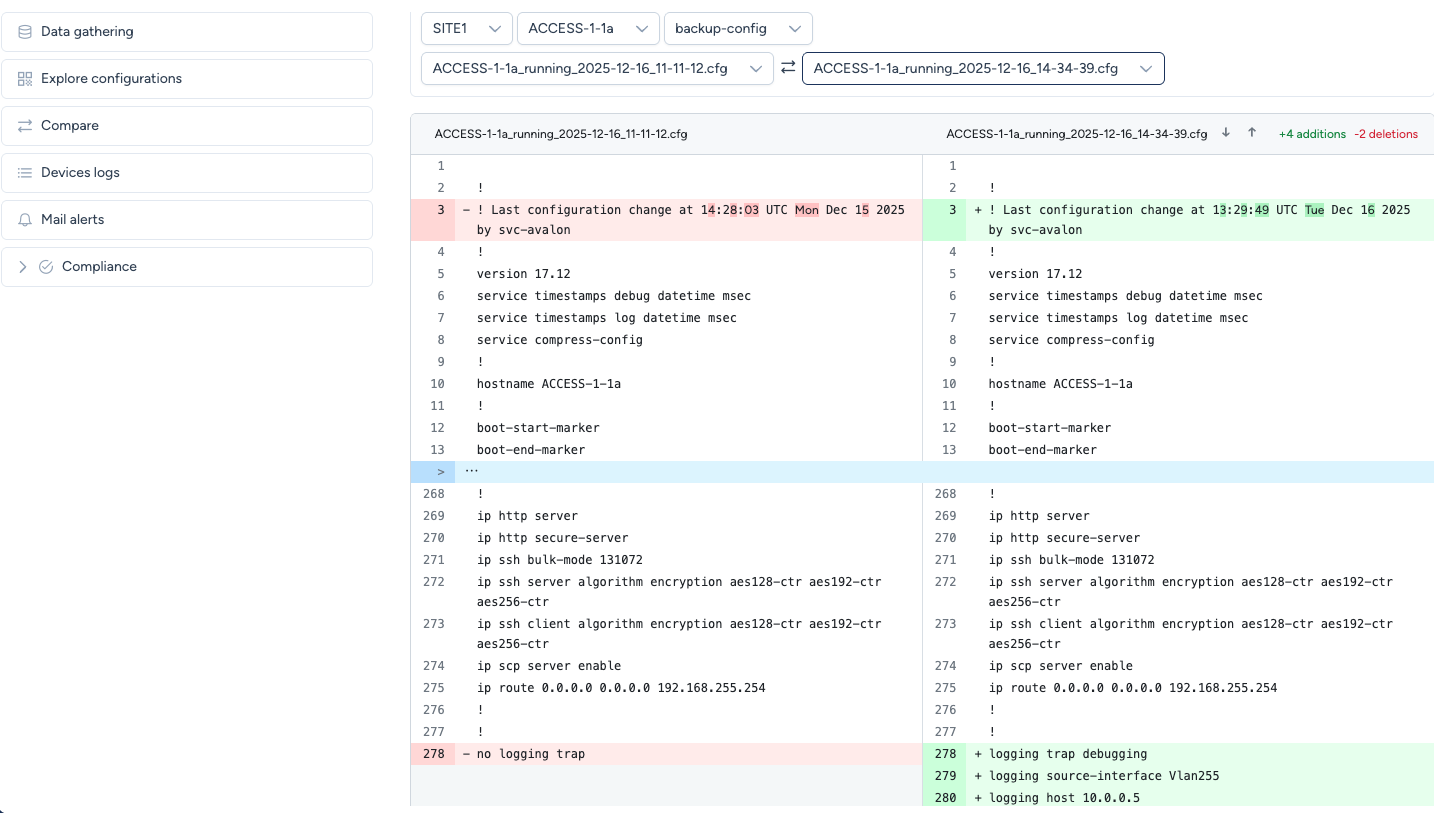
The Compare tool provides a visual "Diff" between two configuration files.
Usage
- Change Validation: Compare the
running-configof a device at two different dates (e.g., "Before" vs "After" maintenance). - Standardization: Compare the configurations of two similar devices (e.g.,
ACCESS-1-1avsACCESS-1-1b).
Visual indicators
- Green Lines present in the right file but missing in the left (Additions).
- Red Lines present in the left file but missing in the right (Deletions).
Devices logs
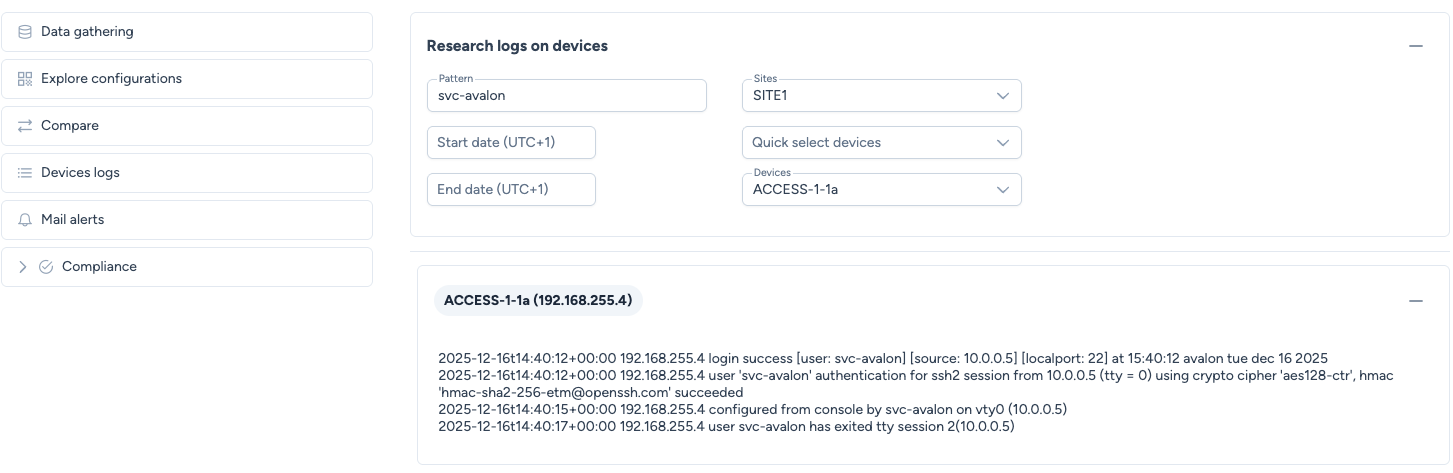
This section provides a centralized interface to search through Syslog messages exported by devices to Avalon.
Usage
You can narrow down the search using:
- Pattern: Keyword search (e.g.,
link-flap,OSPF,user-login). - Time Window: Start date and End date.
- Scope: Specific Sites or Devices.
Mail alerts
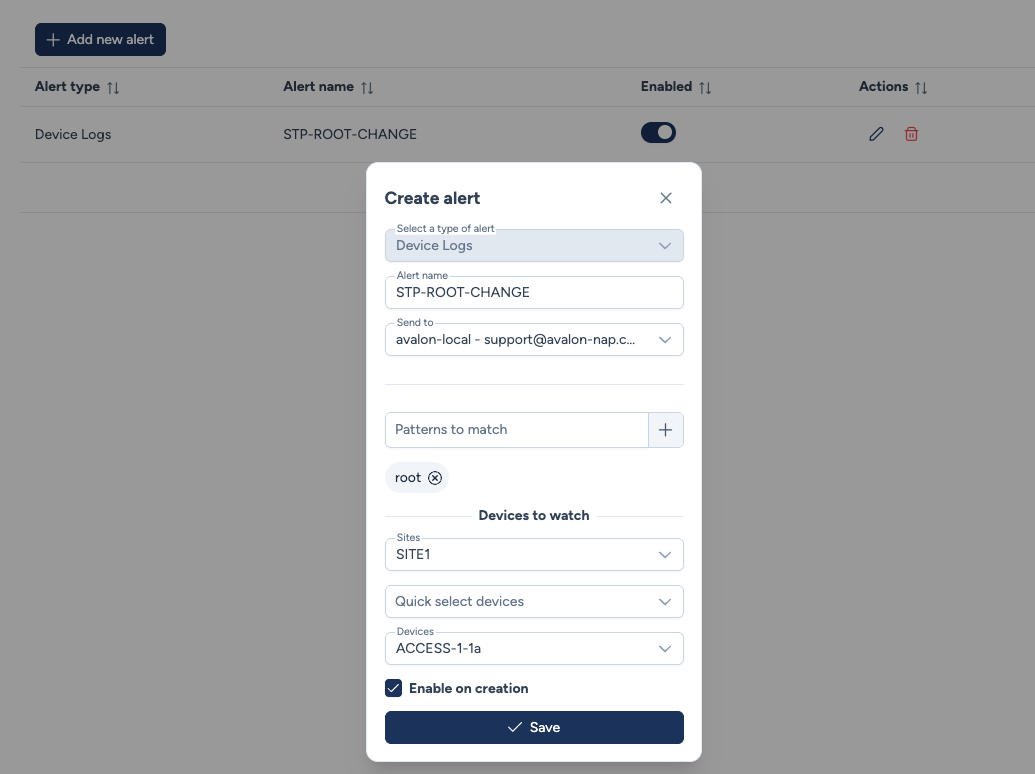
While Devices logs is for historical investigation, Mail alerts allows for proactive monitoring. You can configure Avalon to send an email notification immediately when a specific log pattern is detected.
Creating an alert
- Alert Type: Currently supports
Device Logs. - Alert name: A descriptive name for the alert.
- Recipient / Send to: Select the email address to notify.
- Pattern: The Regex or string to watch for (e.g.,
root,fan fail). - Devices to watch: Define which devices to monitor.
Email example
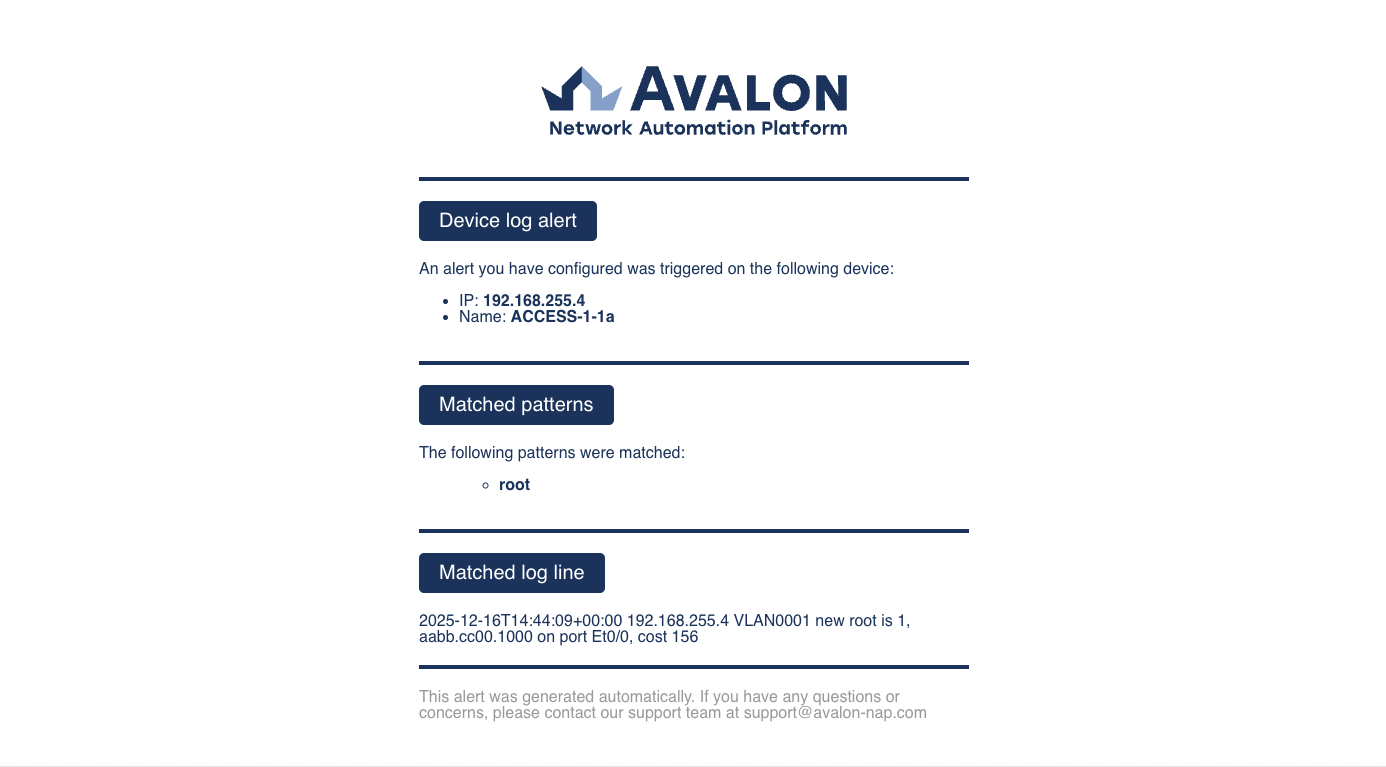
When triggered, the email provides the context required for troubleshooting: the Device IP, the matched pattern, and the raw log line.