Transactions
The Transactions module records every operation performed on the network, whether scheduled or triggered manually.
This ensures complete traceability of changes, offering a granular view from the global intent down to the specific commands sent to a device.
Anatomy of a Transaction
A Transaction follows a hierarchical structure:
- Parent Transaction: Represents the global intent (e.g., "Deploy Syslog Server"). It aggregates the overall result.
- Sub-transactions: Represent the individual action performed on each specific device.
Status Types:
- success All devices were processed without error.
- partial_success At least one device succeeded, but others failed.
- failed The operation failed on all devices.
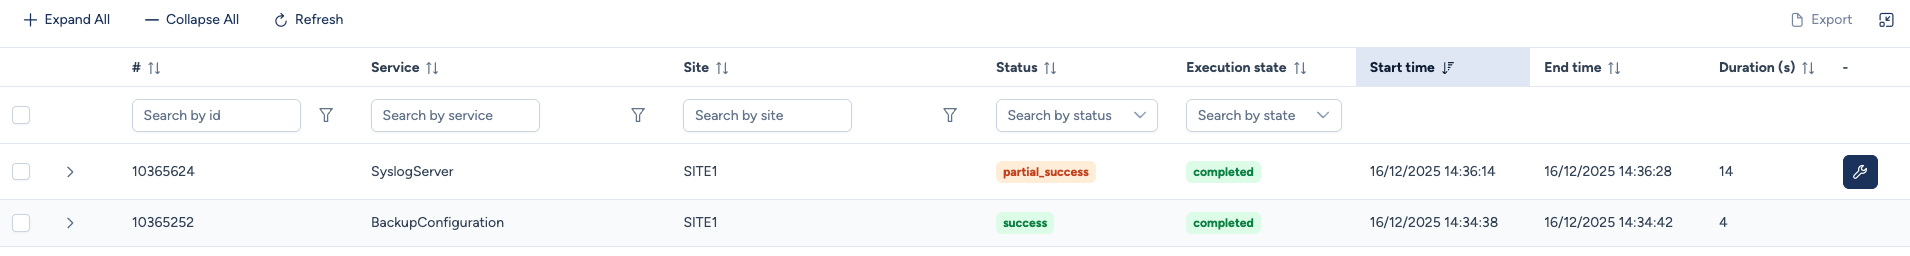
Investigating failures
When a transaction shows a Partial Success or Failure, you can analyze the specific causes. By clicking the arrow icon located on the left of a row, you access the detailed results.
Sub-transaction Details
The expanded view lists every device involved in the operation.
In the example below, we deployed a SyslogServer. While most devices accepted the configuration, one device (AGGREG-1-1) failed.
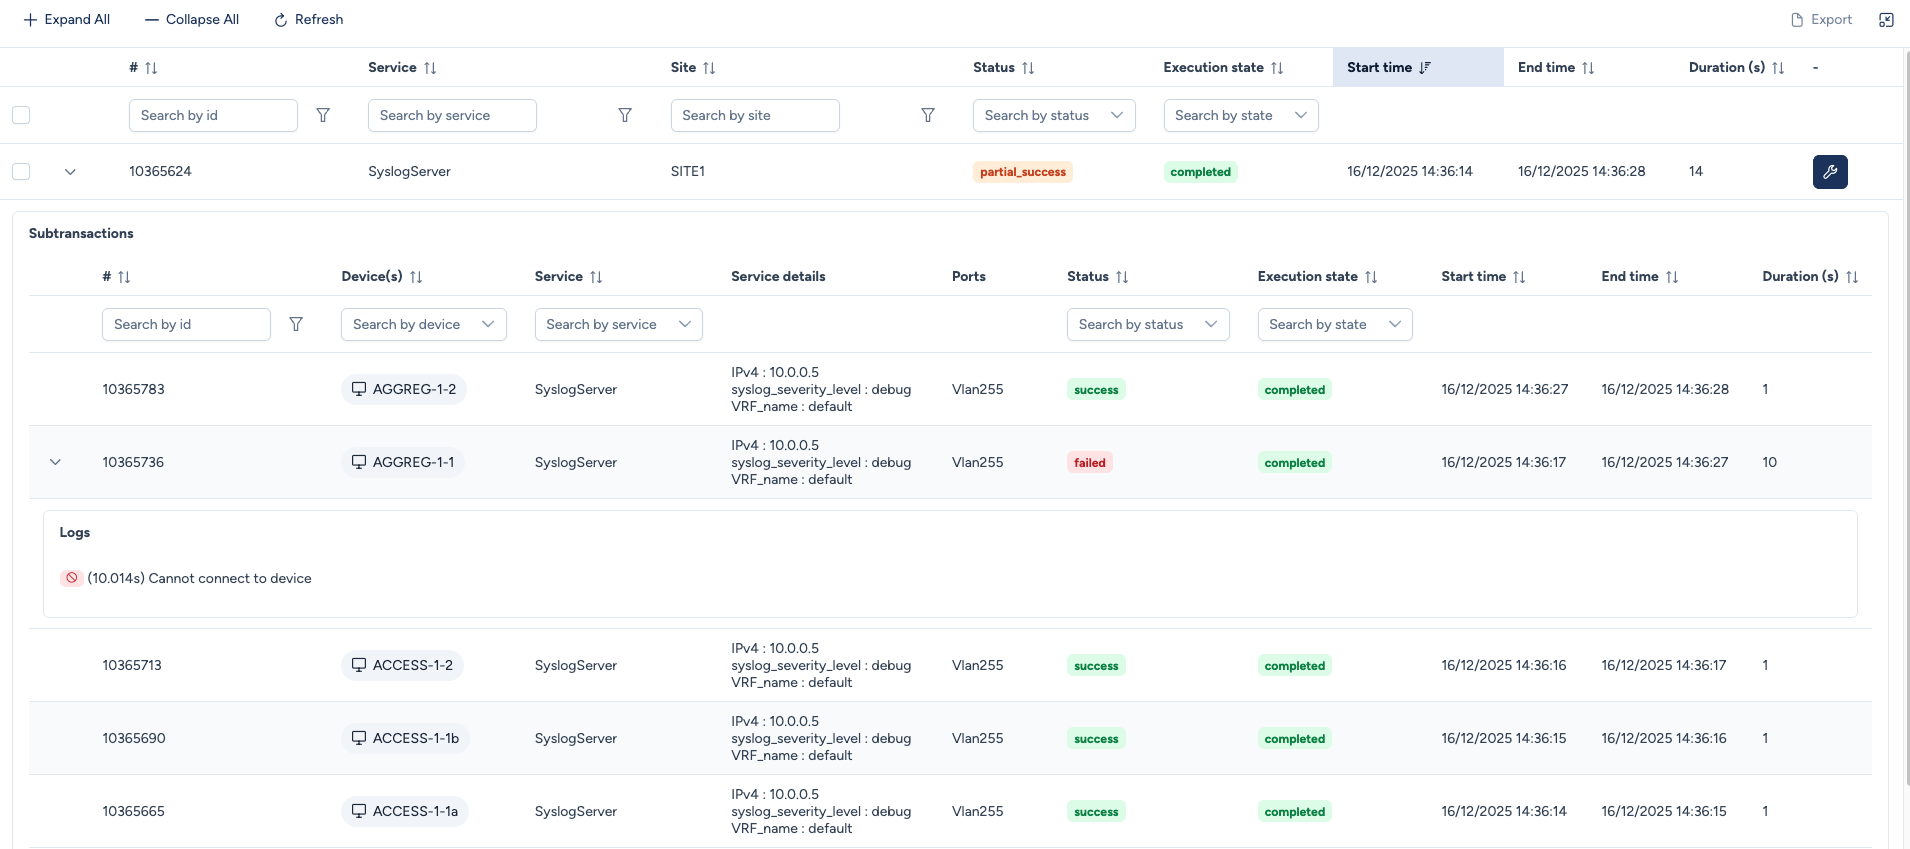
Diagnostic Elements:
- Service Details: Shows the parameters injected during the execution (e.g., IP
10.0.0.5, Severitydebug). -
Logs & Error Messages: If an error occurs, Avalon captures the specific reason to help with troubleshooting.
In this case: The error
Cannot connect to deviceindicates the device was unreachable (timeout), likely due to a network interruption or management plane issue.
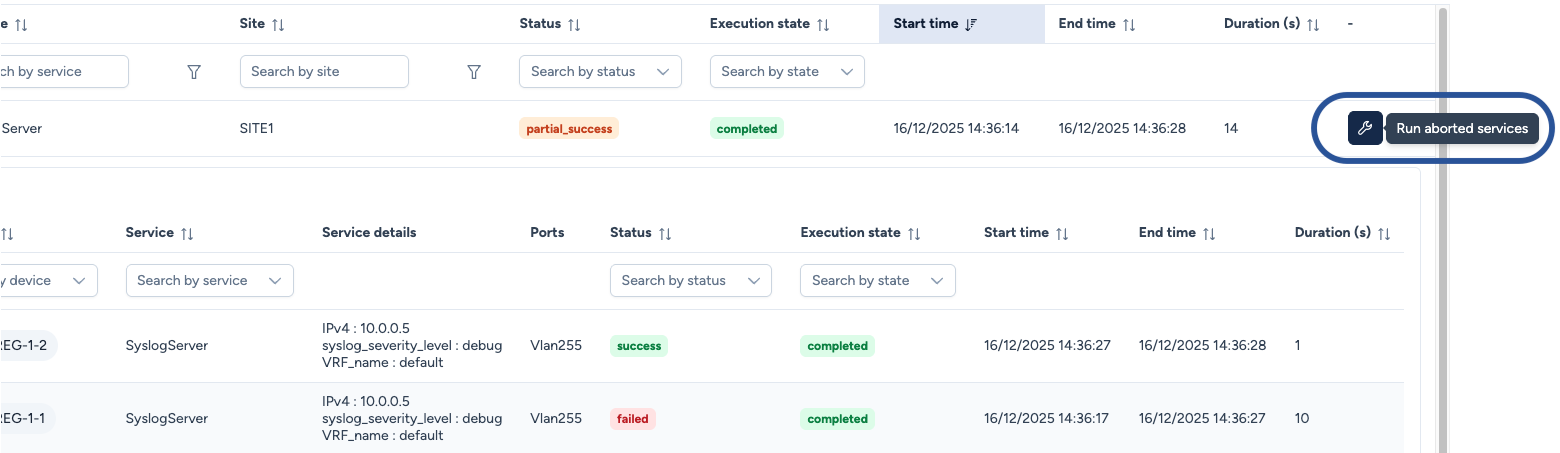
Remediation: Rerunning Aborted Services
Avalon includes a feature to easily replay failed operations. Instead of manually recreating a service for just the devices that encountered a failure, you can trigger a remediation workflow directly from the transactions page.
The rerun workflow
- Identify the Failure: Locate the transaction containing the errors.
- Trigger Remediation: Click the wrench icon on the right side of the transaction line.
Intelligent scoping
Clicking the remediation button redirects you to the Schedule Service interface with a context-aware configuration:
- Automatic Parameter Recovery: All settings (Service type, IP, Variables) from the initial attempt are pre-filled.
- Smart Filtering: Avalon automatically filters out the devices that succeeded. The scope is restricted only to the devices that failed in the original transaction.
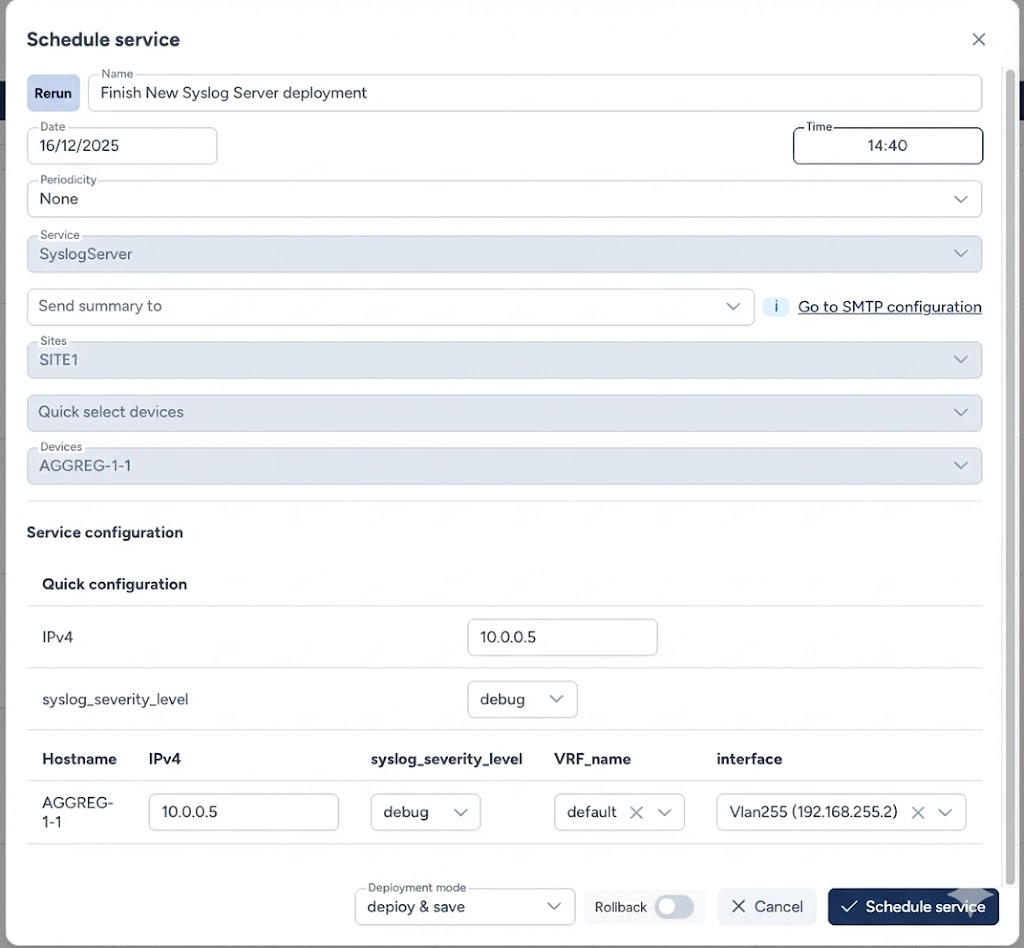
Finalizing the Retry:
- Name: Give the remediation task a name (e.g., "Finish New Syslog Server deployment").
- Schedule: Choose an appropriate time to run the service.
- Validate: Click Schedule service to effectively schedule the remediation service.