Working with a site map
The Site Map represents one of Avalon's primary operational interfaces. Beyond simple visualization, it enables you to manage your network directly through advanced mouse interactions, keyboard shortcuts, and automated service deployment workflows.
Mouse & Keyboard Interactions
Mouse and keyboard shortcuts allow you to quickly manage your devices and organize your site.
Bulk Selection
Hold the Alt key down and drag the mouse to draw a rectangular selection area. All devices located within this zone are automatically selected, ready for bulk operations.
Selection by Click
Hold Ctrl, or Cmd on macOS, and click devices one by one to add them to the selection. Clicking a device that is already selected removes it. This works alongside the area selection when the devices you want do not form a rectangle.
Building Creation
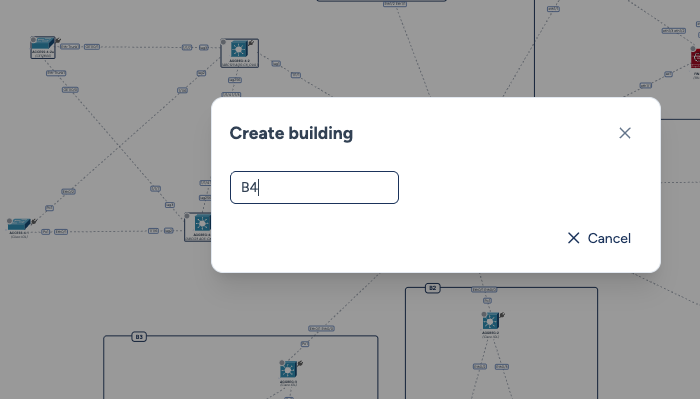
To logically group your devices, hold the Shift key and draw a rectangle by dragging the mouse. Upon release, a modal window appears inviting you to name your new Building.
Building Management
Buildings are much more than simple visual boundaries: they establish a functional link with the devices they contain.
Dynamic Behaviors:
-
Movement: When you move a building on the map, all devices it contains automatically move with it.
-
Dynamic Association: Drag a device inside a building zone to automatically associate it. Conversely, drag it outside the zone to break this link.
-
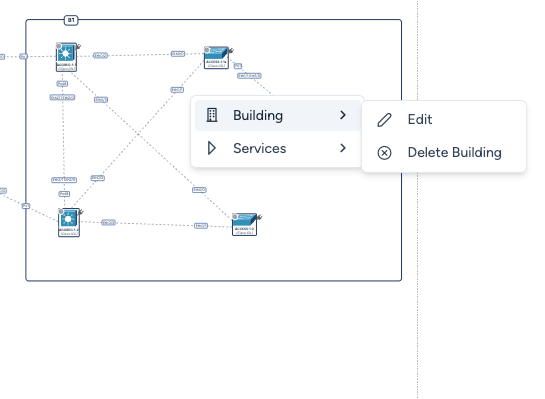
Context Menu: Right-click on a building's title or on empty space inside it to open a menu allowing you to Edit the name or Delete the zone. Note that deleting a building only removes the logical boundary: devices remain on the map.
Link Management
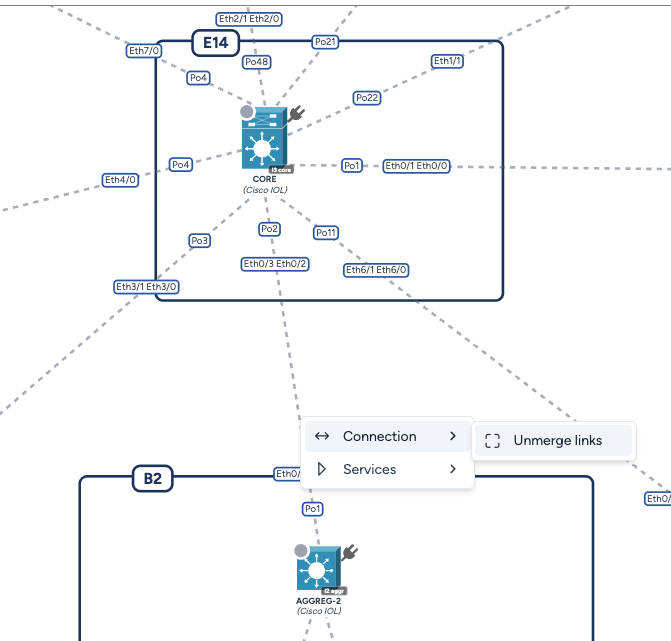
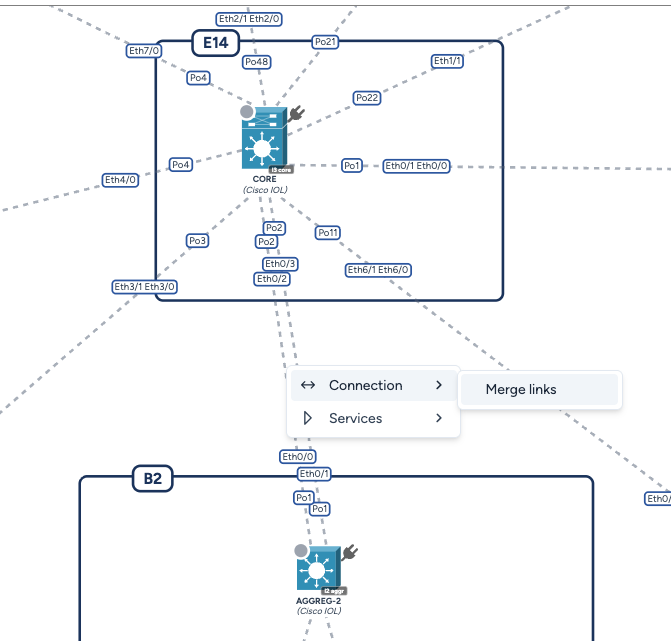
Right-clicking on a link between two devices opens a context menu with connection management options.
Merge / Unmerge
When two devices are connected by multiple physical links (e.g., a port-channel), Avalon displays them by default as a single aggregated link. You can split this link to visualize each physical connection individually.
- Unmerge links: Splits the aggregated link into individual physical links. The port label is displayed on each link.
- Merge links: Groups the individual physical links back into a single aggregated link.
Unmerge all
You can also split all links on the map in a single action via the Unmerge all option in Display settings.
Interface trace (NetBox)
Avalon reconstructs the full cabling path of an interface by querying NetBox: every hop is shown, from patch panels to carrier circuits, all the way to the remote device.
1. Spot the traceable links
Enable the Traceable connections option in the Display settings. The map then highlights the links for which NetBox knows a detailed path.
2. Open the trace
Right-click the link, then Connections → Trace. The submenu lists the traceable interfaces as device (port) → device (port).
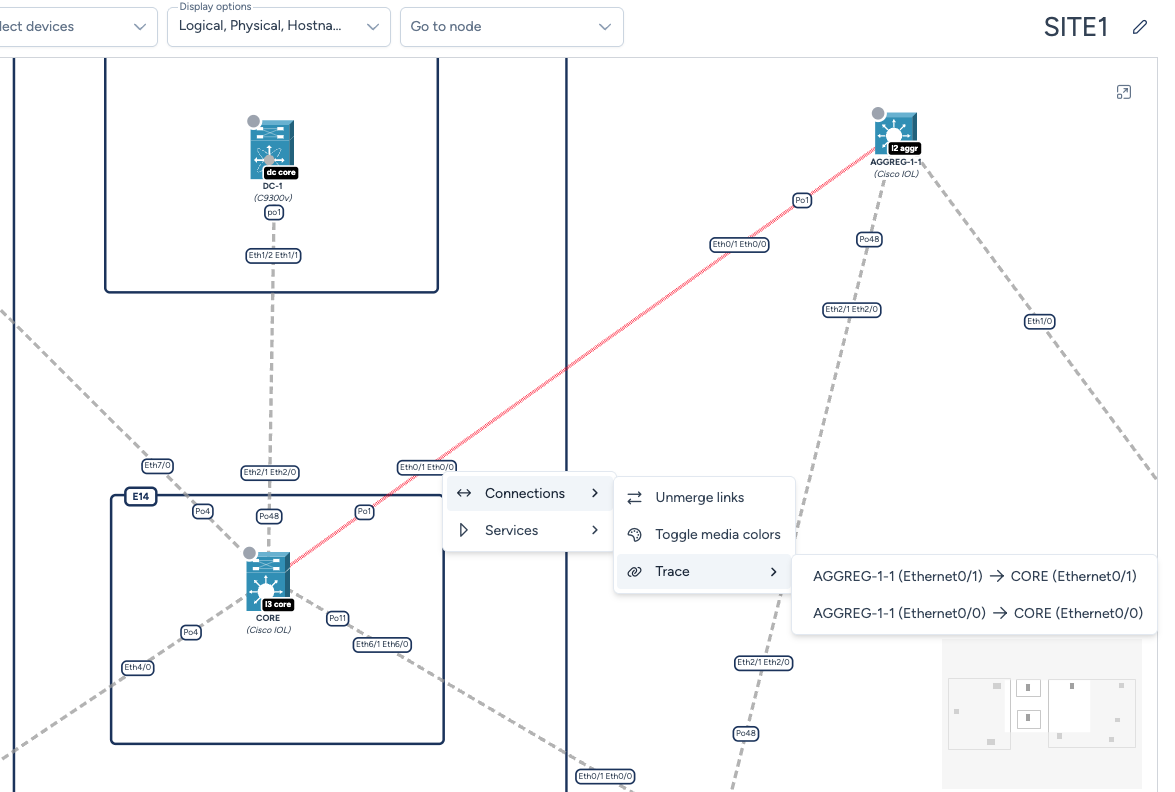
On an aggregated link (port-channel), every physical connection of the bundle is offered and you pick the one to trace. On a simple link, only the connection you clicked appears.
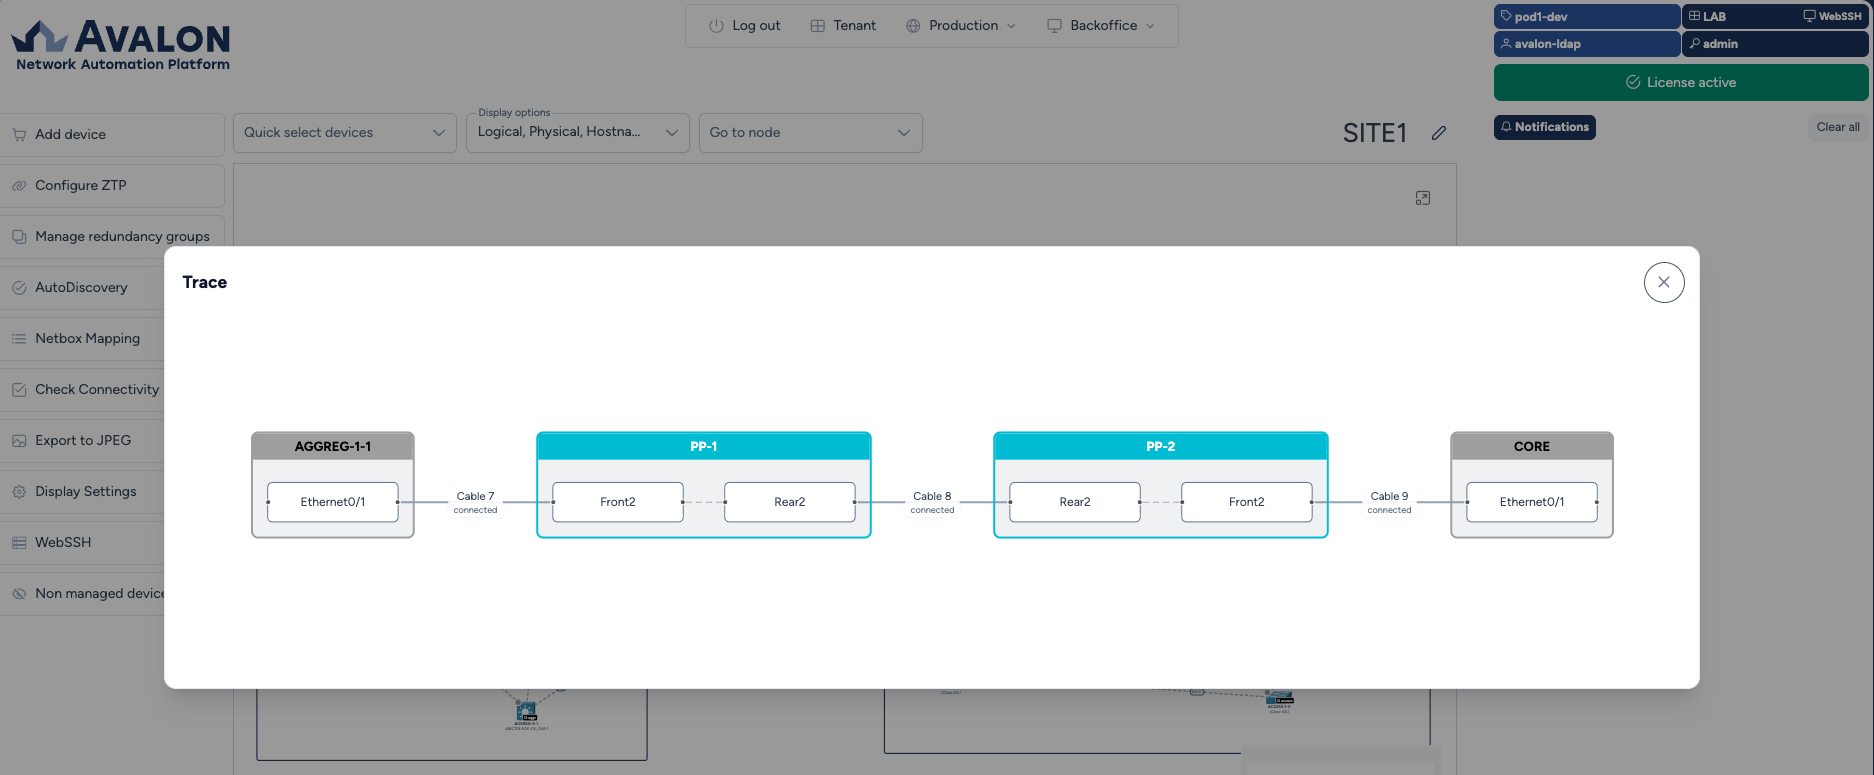
The rendering reuses NetBox colors to stay consistent with your source of truth: role color for devices, type color for circuits. Cable details (label, type, length) are shown when available, including on NetBox versions that do not return them directly in the trace.
When the option does not appear
Only interfaces with at least one intermediate hop are offered. A direct link between two devices, with no patch panel or circuit in between, has nothing to trace.
This feature requires NetBox to be configured for the tenant.
Device Management
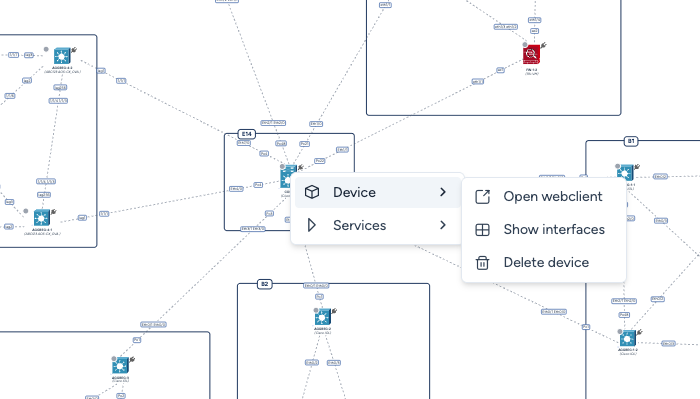
Right-clicking on a device icon opens a context menu that centralizes immediate management and diagnostic tools.
WebSSH
The Open Webclient option launches the WebSSH interface, a browser-based terminal that provides you with secure CLI access to your network devices.
WebSSH is also accessible from any page via the WebSSH icon in the status bar.
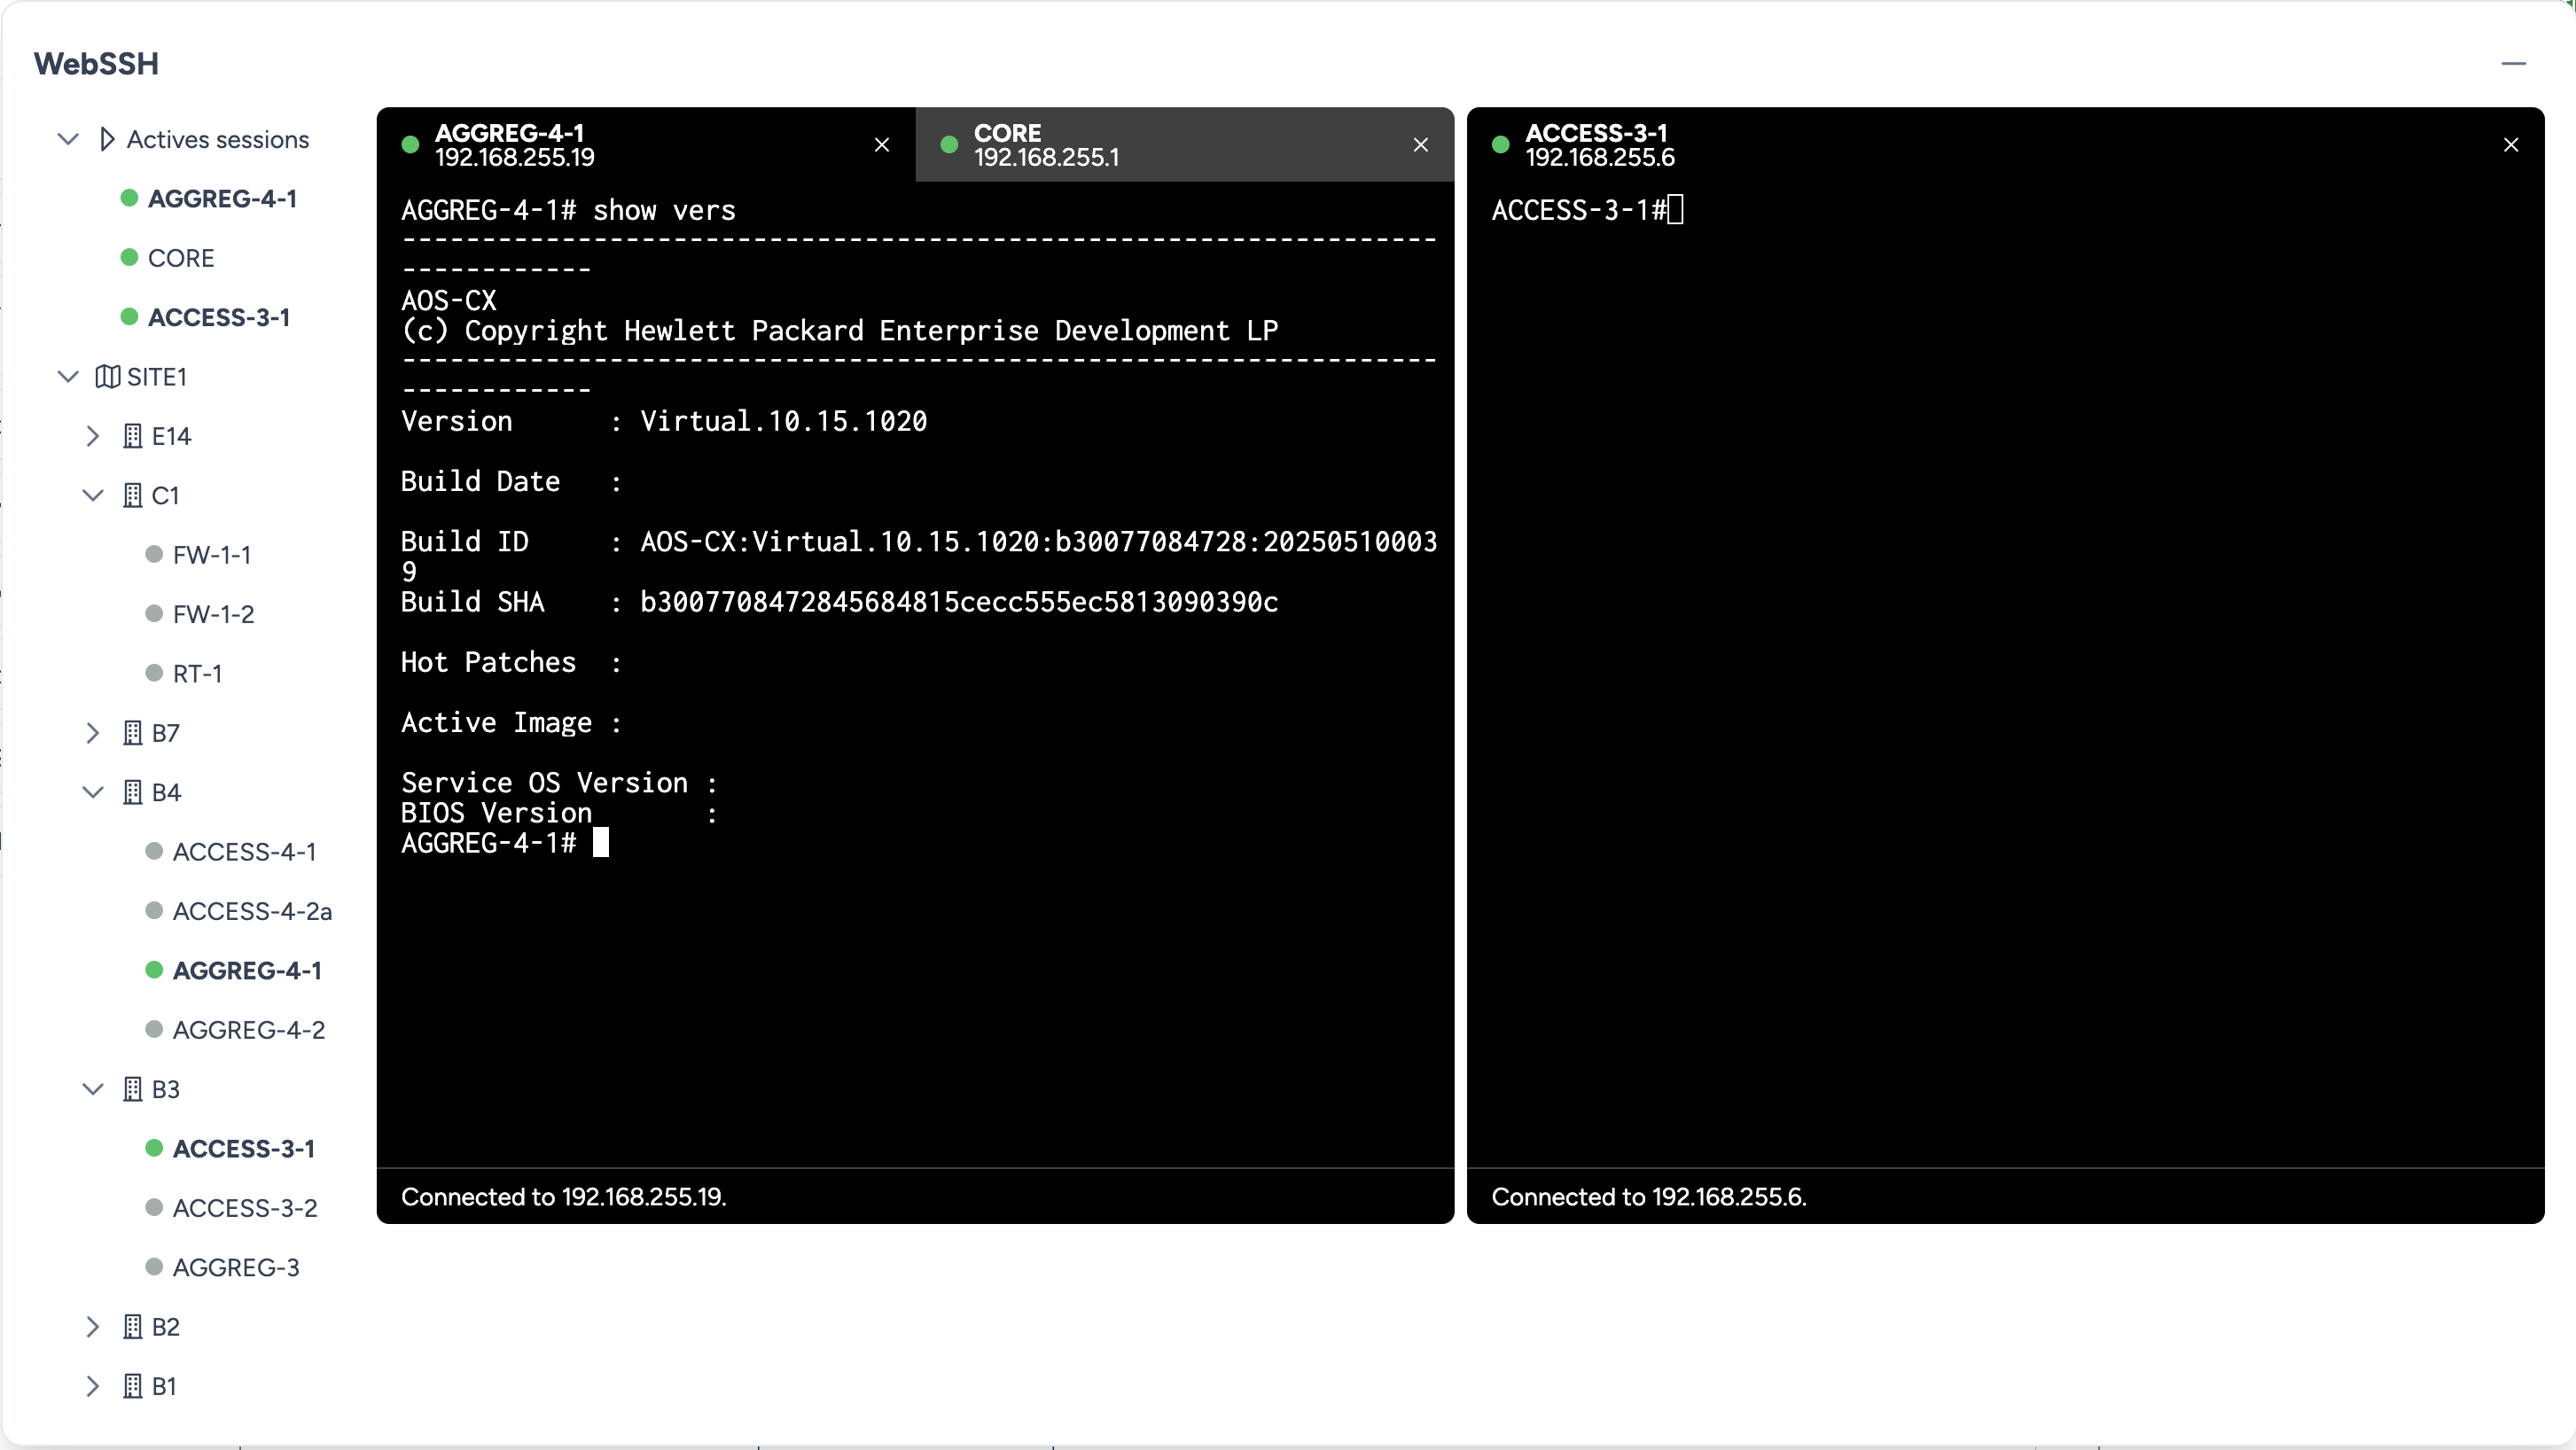
The WebSSH modal offers a centralized management console with advanced session handling capabilities:
Tenant-wide view:
- All tenant devices: WebSSH displays all devices across the tenant, not just those from the current site.
- Hierarchical organization: Devices are grouped by sites and buildings in the left panel.
- Hostname search: A search bar allows quick filtering of the device list by hostname.
Multi-Device Session Management:
- Concurrent Sessions: Open and manage multiple SSH sessions simultaneously within a single modal window.
- Tab-Based Navigation: Each connection appears in a separate tab, allowing you to quickly switch between your active terminals.
- Active Sessions Tracking: A dedicated section displays all your currently connected sessions with visual status indicators.
- Session Persistence: Navigate freely between tabs: your command history and active sessions remain intact.
Interface Elements:
- Left Panel: A collapsible tree view presents your devices grouped by site and building, accompanied by visual connection status indicators.
- Terminal Tabs: Each tab displays the device hostname along with its management IP address for quick identification.
- Connection Status: Connection status appears in real-time at the bottom of each terminal window.
- Connection errors: If a connection fails, an explicit error message is displayed directly in the terminal (authentication rejected, unreachable device, etc.).
Interfaces
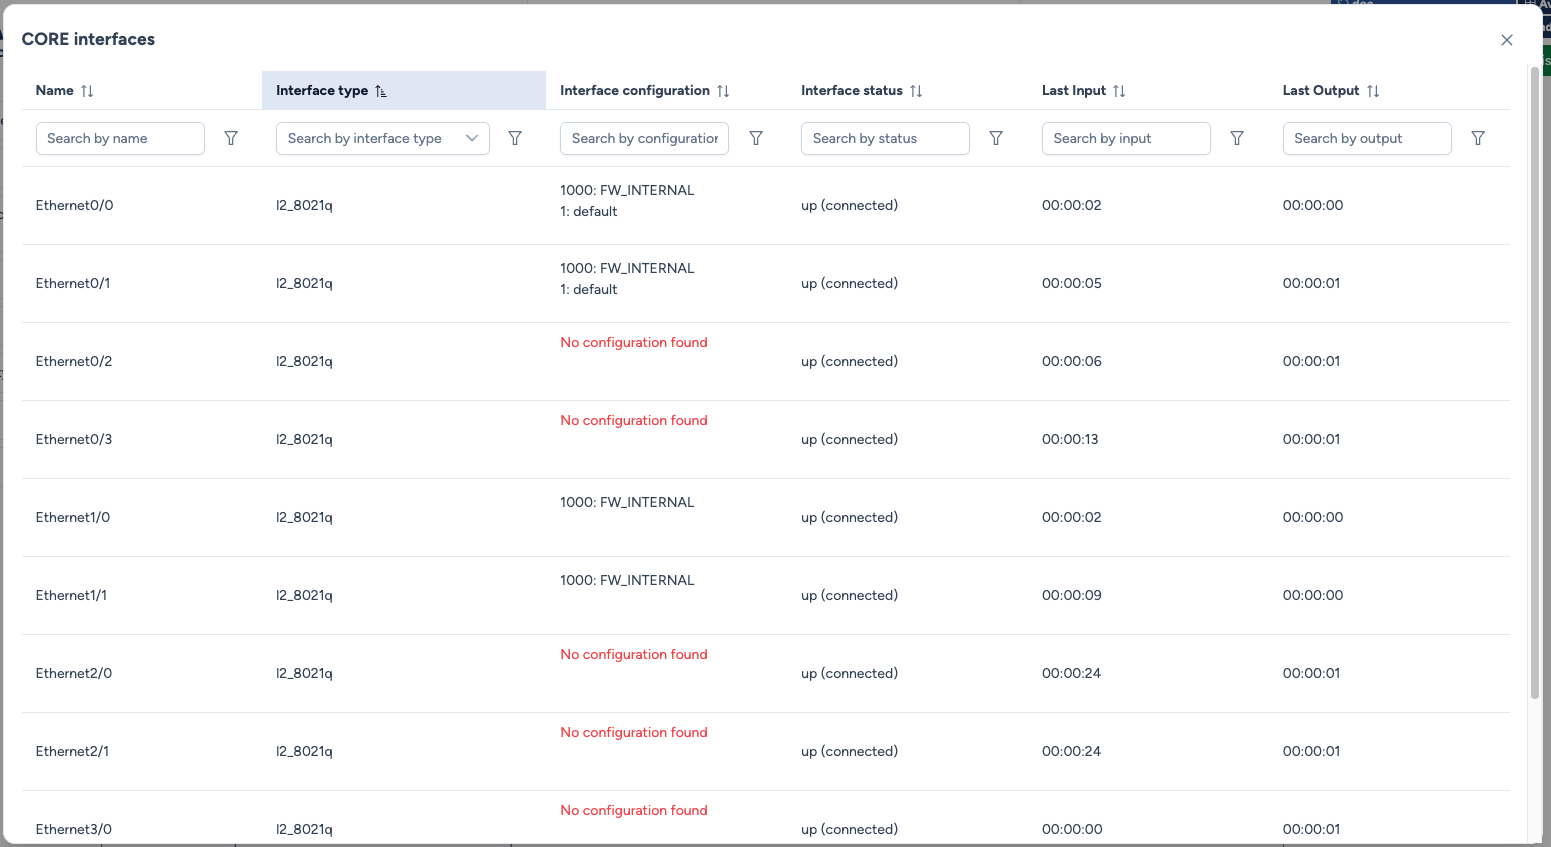
The Show Interfaces option opens a detailed view of all device interfaces, displaying the state stored in the database, configuration type, and input/output counters.
Device Deletion
The Delete Device option triggers a confirmation modal to safely remove the asset from the site inventory.
Service Deployment
Avalon enables network configuration deployment through two complementary approaches: per-device services (unitary) and composite services (multi-device).
Unitary Services
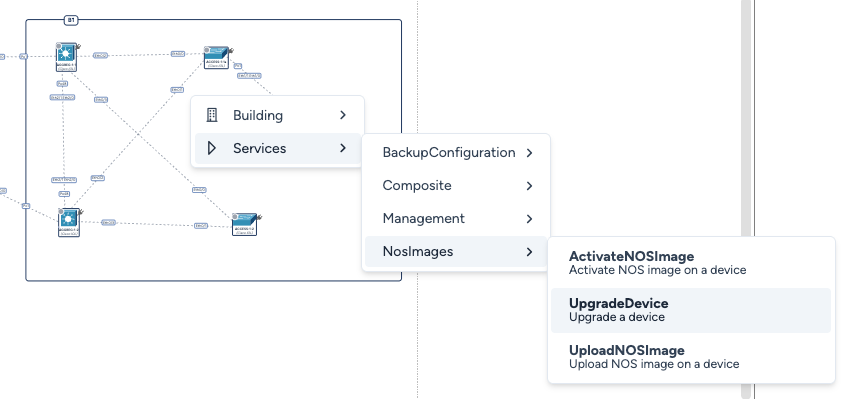
These services apply to a selection of one or more devices. Right-click on your selection to open the Services menu and choose the appropriate template.
This includes all services except those in the Composite category.
Failsafe Parameters
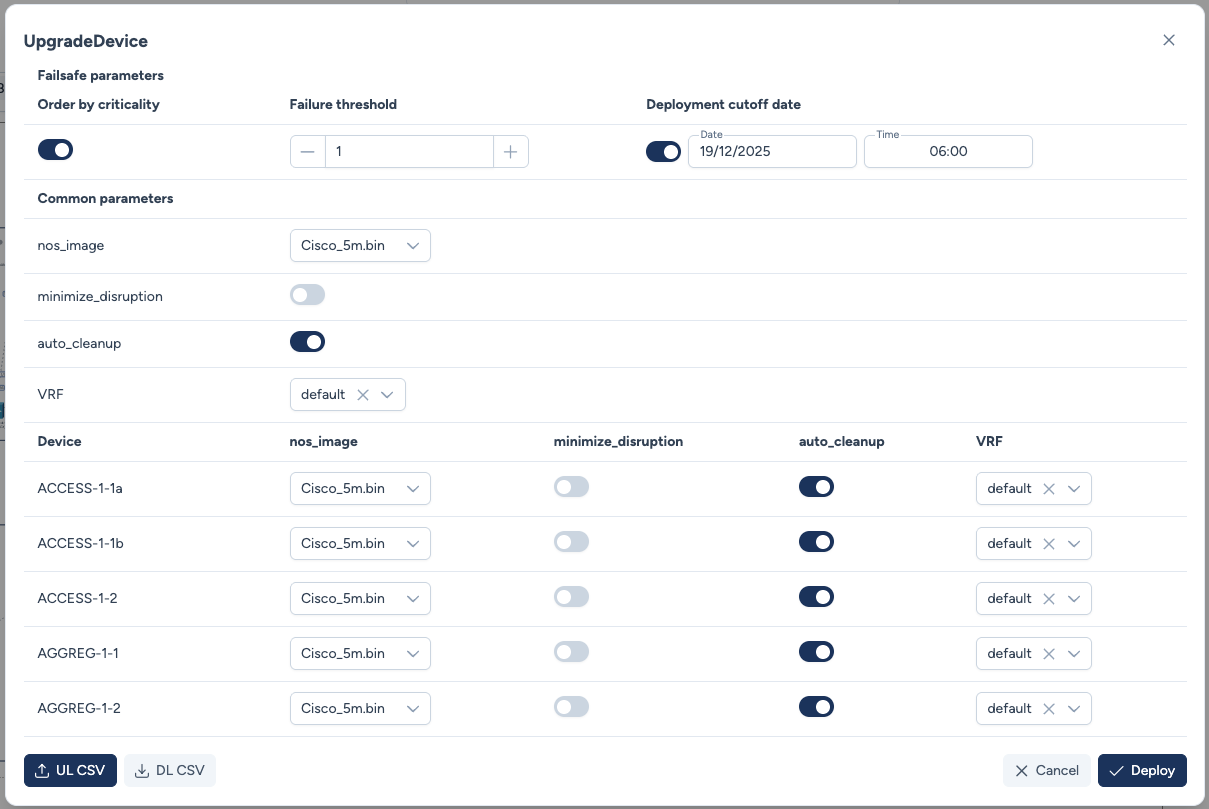
The configuration modal integrates three critical safeguards designed to preserve your network stability during deployment:
-
Order by criticality: When this option is enabled, Avalon deploys the service starting with devices having the lowest criticality (furthest from the network core), then progressively works up toward critical devices.
- Note: This prioritization is automatic. Manual criticality configuration is under consideration.
-
Failure threshold: Defines the maximum number of deployment failures allowed before Avalon automatically aborts the operation to prevent malfunction propagation.
-
Deployment cutoff date: Sets a deadline for the operation, allowing you to prevent reboots or interruptions from occurring during business hours.
Composite Services
A composite service automates a logical chain of unitary services intelligently applied across multiple devices. To access them, right-click on an empty area of the map or inside a building.
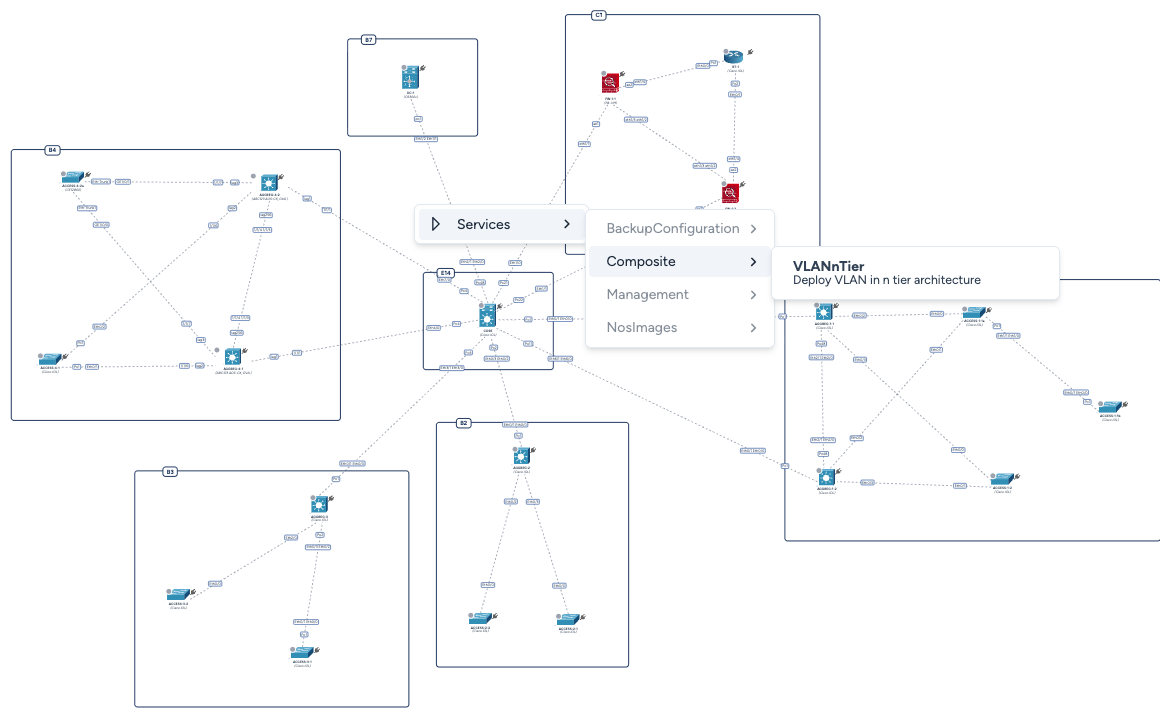
Example: VLAN n-Tier Service
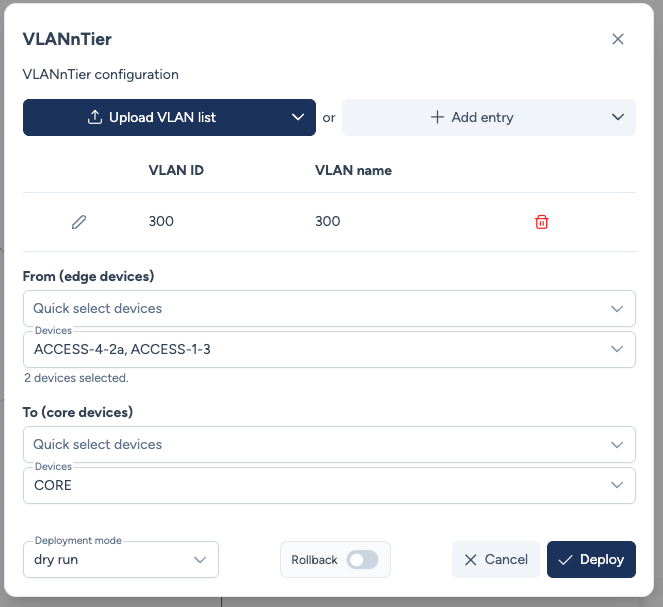
This service automates the deployment of a VLAN across a whole chain of links, from the devices you name to the ones you aim at.
How it works:
-
Two selectors: From (edge devices) names the starting devices, To (core devices) the ones to propagate towards. The second is optional: left empty, the service aims at the cores flagged by the discovery.
-
Path calculation: Avalon automatically identifies the complete chain of links between the two, following only ports configured in 802.1Q (trunk).
-
Stopping at the layer 2 break: propagation stops at the first port that is not a trunk, be it a routed link or an access port. The VLAN is applied up to the last device reachable over trunks, and the rest of the path is dropped. If the very first hop is already not a trunk, the pair is skipped.
Why stop rather than give up
A tagged VLAN cannot be carried over a routed link. Rejecting the whole path would make the service useless in an EVPN fabric, where the aggregation to core link is precisely routed. The layer 2 boundary is therefore computed, never declared: you state an intent, Avalon goes as far as it can.
Supported platforms
The service relies on a configuration template written for each system. It is available on Cisco IOS and IOS-XE, Cisco NX-OS, Aruba OS-CX, HP Comware, HP ProCurve and Huawei VRP. On a device running another platform, it is not offered.
Validation and Monitoring
Dry Run
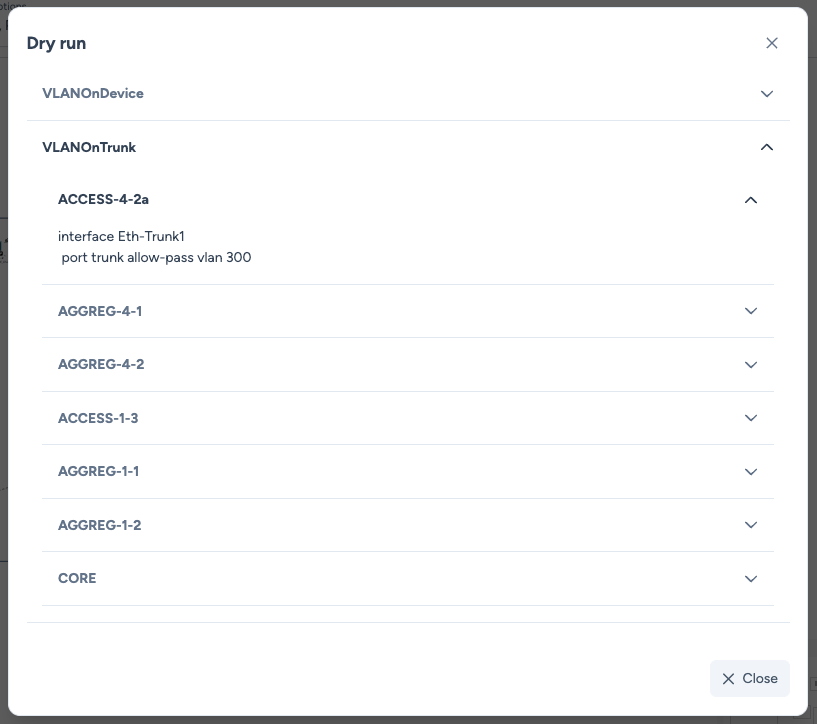
For all service types (unitary and composite), Dry Run mode allows you to precisely preview the CLI commands that will be injected into each device, without any actual modification.
Production Execution
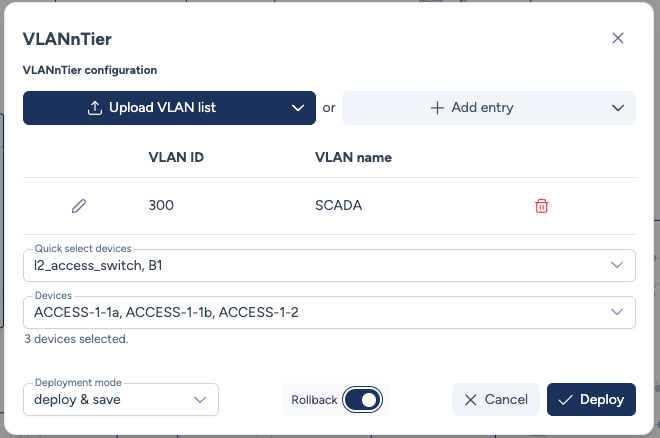
Once your configuration is validated, the service enters the deployment phase. At this stage, you simply need to:
- Select a production deployment mode (for example, Deploy & Save)
- Choose whether you want to enable the automatic Rollback feature
Learn more about rollback
For a detailed explanation of how rollback works, its states, and best practices, see the Rollback workflow guide.
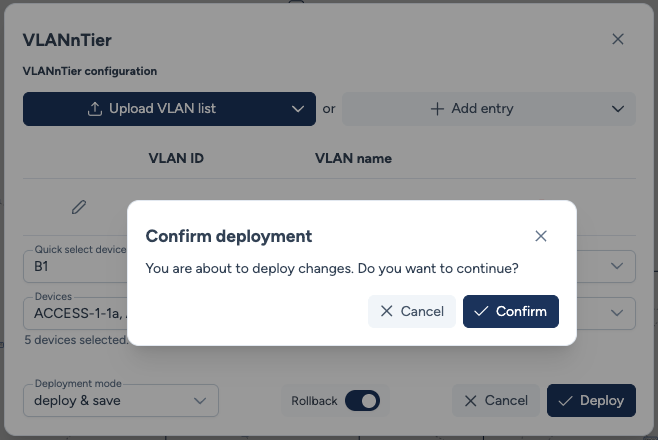
A final confirmation modal appears before changes are applied to your production environment.
Real-Time Tracking
Avalon then creates a transaction that you can monitor in real-time. The Transactions page allows you to visualize detailed progress, status, and duration of each sub-transaction on a per-device basis.

Note
The Transactions page does not auto-refresh, but the Refresh button makes a server call to update the transaction status.